

Energy Market Check-In: WTI Crude Oil, RBOB Gasoline, Heating Oil & Natural Gas (July 13, 2026)
A daily-chart walk through crude oil, gasoline, heating oil, and natural gas on July 13, 2026 — three markets riding a fear rally, and one quiet market that finally showed its hand.
Welcome back. We're in the middle of July now, which means we're in peak driving season, the heart of summer cooling demand, and the early innings of hurricane season in the Atlantic. If there was ever a month built for the energy markets, this is it.
And the news sure delivered. Over the weekend the U.S. and Iran traded strikes over the Strait of Hormuz, the narrow stretch of water where a big share of the world's oil rides through on tankers. Traffic through the strait has slowed to a trickle, and the petroleum side of the board has been running higher ever since.
So today let's walk the daily charts of four energy contracts and ask one simple question at each stop: is the chart telling the same story as the headlines? Because three of these markets are trading fear right now, and the fourth one just did something completely different. That difference is the whole lesson.
August 2026 WTI Crude Oil (CLQ26)
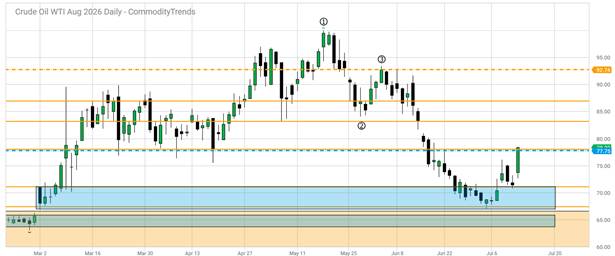
August crude is trading around 78.32 as I write this, beginning the week in strong fashion. But before we get too excited, let's back up and look at where this rally came from, because the chart has been telling a story all summer.
Look at the ①-②-③ points marked on the chart. Crude put in its high near 100 back in mid-May, bounced, and then rolled over from point ③ in early June. That's a classic 1-2-3 top, and it played out just the way the pattern suggests — price slid all the way down into the BLUE daily support zone between roughly 67.04 and 71.12, where it finally found buyers in early July.
Then the Hormuz headlines hit, and the fear premium came rushing in. Nobody knows whether oil supply will truly get cut, but nobody wants to be short while they find out, either. That rush has carried price right up to the BLUE daily 50% level at 77.75, and crude closed just above it. That's the line I'm watching now. If crude can hold above 77.75, the door opens toward the old gold weekly chart horizontal levels in the mid-80s, with the GOLD weekly 50% level way up at 92.74 as the bigger test. If it slips back below, then we just watched a headline spike burn itself out. Fear premiums come in fast and they can leave just as fast, but the levels stay put. That's why we mark them first.
August 2026 RBOB Gasoline (RBQ26)
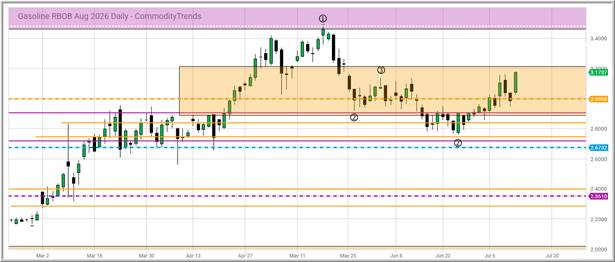
August gasoline is trading near 3.17, and it has quietly built one of the cleaner charts in the whole complex. Remember what season we're in. July is the meat of the summer driving season, with vacations and road trips and your neighbor's cousin's uncle hauling his boat to the lake, so demand at the gas pump is about as strong as it gets all year.
Now look at the chart. RBOB topped at 3.4781 -- the ① point in mid-May, right at the bottom of the PURPLE monthly zone, then spent almost two months chopping sideways inside that big weekly chart zone. It came down and tested its footing twice along the way — those two ② marks — and both times the buyers showed up. Last week price climbed back through the GOLD weekly 50% level at 2.9958, and now it's pressing the top of the box near 3.20, the same area marked ③.
That box top is the level I'm watching. If gasoline can climb out of the box and hold its ground, the old ① high at 3.4781 becomes the next magnet overhead. If it gets turned away here instead, then a new possible 1-2-3 top starts to take shape. Either way, the chart will tell us — it always does.
August 2026 Heating Oil / ULSD (HOQ26)
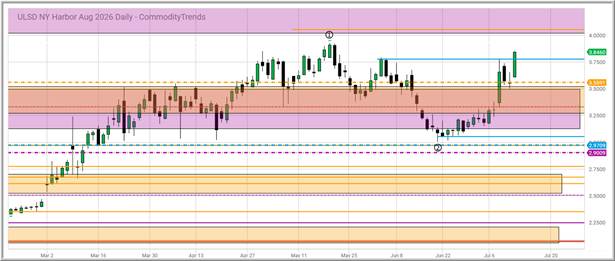
Here's the strongest member of the family. August heating oil — ultra-low sulfur diesel these days — is trading at 3.8459 after a big green candle punched through the early-June highs around 3.7947. Why so strong? Diesel supply is tight all over the world. Russia, one of the biggest diesel exporters on the planet, has suspended exports after strikes disrupted its refineries, and when a big seller leaves the store, prices at the store go up.
The chart shows the whole journey. ULSD put in its ② low just above 3.0013 on June 18, right above the BLUE 50% level at 2.9709, and it has hardly looked back since. It cleared the GOLD weekly chart 50% level at 3.5591 on the way up, and now it's within reach of the old ① top at 3.9308, with the PURPLE monthly zone sitting right above it.
So the level I'm watching is that 4.00 area. Old tops have a way of greeting a returning market like a bouncer at the door, and how price behaves on its first trip back up there will tell us plenty. A market this strong has earned some respect, but chasing strength late is how traders end up buying the high. Let the level do its job.
August 2026 Natural Gas (NGQ26)
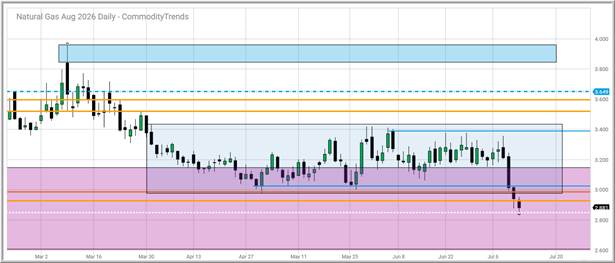
And now for the market that rewrote its own story. For nearly four months, natural gas sat coiled inside a tidy box while the rest of the energy sector bounced around. I've said it before: a quiet market is often a market getting ready to move. Well, it finally moved — straight down!
August natural gas broke through the floor of that box and fell more than 6% in a single day, the steepest daily drop since March. It's now trading at 2.886, down inside the PURPLE monthly chart support zone and resting right on the dotted line near 2.86, which is the level I'm watching now.
Why did gas fall while everything else rallied? Because natural gas is a homebody. It trades American weather and American supply, not oil tanker traffic half a world away. The forecasts turned cooler, storage is running about 6.6% above the five-year average, and the Freeport LNG plant just started a maintenance shutdown that cuts export demand into late August. In other words, strong supply met softer demand, and the coil finally snapped — to the downside!
Here's the beautiful part: you didn't need to predict any of that. You only needed the box marked on your chart. When price left the box, the chart told you the direction loud and clear.
The Common Thread
Now step back and look at all four charts together. Crude, gasoline, and heating oil are all riding the same fear headline higher, and each one has arrived at a level that will decide what comes next. Natural gas ignored the headline completely and broke down on its own supply story. That's four markets in the same complex, on the same day, telling two opposite stories.
Why does this matter? Because if you had traded energy today from the hip, off nothing but the war headlines, you would have treated all four markets the same — and one of them would have handed you a fast lesson. The headlines tell you why a market moved, but the chart tells you where it matters. PURPLE, GOLD, and BLUE — the monthly, the weekly, and the daily — those zones were drawn before the missiles flew and before the gas forecasts cooled, and they'll still be there after the dust settles.
So mark your levels, set your risk, and let the market come to you. The news moves the market. The chart moves me. Same game, each and every week!
I'll keep tracking these markets in the daily videos and the Friday "Markets Jim Is Watching" weekly email newsletter when appropriate. If you're new here and want to see how we read these same charts in real time, that's what the membership is built for — but there's plenty to learn right here on the blog, too, no strings attached.
Questions about anything you
read here? Reach our team at: support@commoditytrends.com
— Jim Prince, CommodityTrends.com
Educational content only. Futures and options trading involves substantial risk of loss and is not suitable for every investor. Nothing here is a recommendation to buy or sell any contract. Past performance is not indicative of future results.