


A look at two energy markets as summer driving fades into the rearview mirror and the heating season approaches.
There is rarely a dull moment in energy. Middle East developments, Gulf Coast hurricane concerns, and ceasefire headlines are giving traders plenty to digest. But energy markets almost always have a big story competing for attention.
Seasonality matters, too. Summer driving is over, cooler weather is coming, and hurricane season is not quite finished. Each shift can influence supply, demand, and prices.
News may explain a move, but charts show what price is actually doing. That is where I focus. Let’s look at two markets.
November 2026 Crude Oil: Watching the Range Near $94
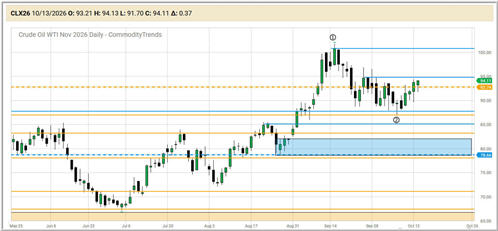
November WTI Crude Oil is near $94 per barrel this morning, up less than a dollar. Over the past year, it has traveled from the mid-$50s to the upper $110s. Quite a range!
Lately, crude oil has been trading sideways. One headline brings buyers in; another brings sellers back. Neither side has clearly taken charge.
On the chart, price is once again attempting to hold above the weekly 50% level. Just overhead, I have a daily resistance level marked at 94.75, followed by another important level near 100.75. I am also watching for a possible topping pattern. So far, the #1 and #2 top points are in place, but the pattern is not complete.
A market can look ready to move without giving us a trade. I would rather wait for a setup than anticipate every turn.
November RBOB Gasoline: A Seasonal Shift Worth Watching
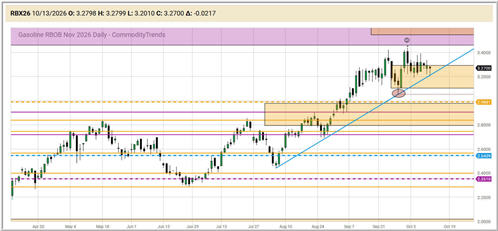
November RBOB Gasoline is near $3.2640 per gallon, down about 1.3% in its latest session. Its one-year range stretches from below $1.70 to above $3.40.
Gasoline also has its own seasonal tendencies. As the summer driving season ends and the switch away from summer-blend gasoline takes place, demand patterns begin to change. That does not guarantee lower prices, of course. Seasonal tendencies are helpful background information, not trading signals by themselves.
What interests me now is the possibility of a topping formation on the daily chart. Should a valid pattern develop, I may consider a bearish position using futures or put options. But first, I want the chart to provide some confirmation.
In particular, I am watching the September 29 low for a potential Momentum Entry Technique setup. A break could become meaningful if the rest of the setup falls into place. Until then, it remains something to monitor rather than a reason to jump in.
Final Thoughts: Let the Charts Do the Talking
Crude oil and gasoline have different seasonal influences and different chart structures, but the trading lesson is much the same.
Storms, geopolitical developments, supply, and demand all grab attention. They can also tempt us to act without a plan. Reacting to every headline often makes trading harder.
Instead, I prefer to work from the bigger picture down. I start with the monthly chart, check the weekly chart, and then use the daily chart to identify levels, zones, and possible entries. This approach helps me stay focused on price rather than trying to predict the next news event.
If the setup is there, I can make a plan. If it is not, I can wait. There is nothing wrong with that.
The takeaway this week is simple: Let the headlines make the noise. Let the charts guide the decisions.
Have a great week, and stay patient out there.
— Jim Prince, CommodityTrends.com
*Educational disclaimer: This post is for educational and informational purposes only. It is not a recommendation to buy or sell any futures contract or other security. Trading futures and options involves substantial risk of loss and is not suitable for every investor. Past performance is not indicative of future results. Prices cited are approximate and were gathered from public sources on October 13, 2026; always check your own data feed.
