
Summer Has Arrived — And the Energy Markets Are Already Talking
Memorial Day is behind us. Just like that, the calendar tells us summer is here. For the energy markets, this is a fun stretch of the year. The U.S. summer driving season has officially started. The 2026 Atlantic hurricane season begins this coming Monday, June 1. And the four big energy contracts I want to walk through today — crude oil, gasoline, heating oil, and natural gas — gave us plenty to talk about right out of the gate.
If you only glanced at today's screens, you'd see one thing across the board: red. Crude was down good. So was gasoline. Heating oil followed right along. The reason was a single headline — fresh optimism around U.S.–Iran peace talks. Less worry about supply means lower prices, and traders moved fast.
But here's where the real work begins.
In my April 2026 Commoditytrends newsletter I made the point that the first move after a big headline is not always the most important move. What matters most is what comes next. Today's drop is the first move. The next move is what we're really watching. Let's walk the board.
July micro Crude Oil (CYN26)
July micro crude last traded near 93.95 (at the time of this writing), down roughly 2.67 on the day. But step back from the single down candle and look at the bigger story. Crude has been on a strong run for weeks, pushed higher by worries about the Middle East. Today, with the tone of the headlines flipping, price pulled back into an area where the chart work really matters.
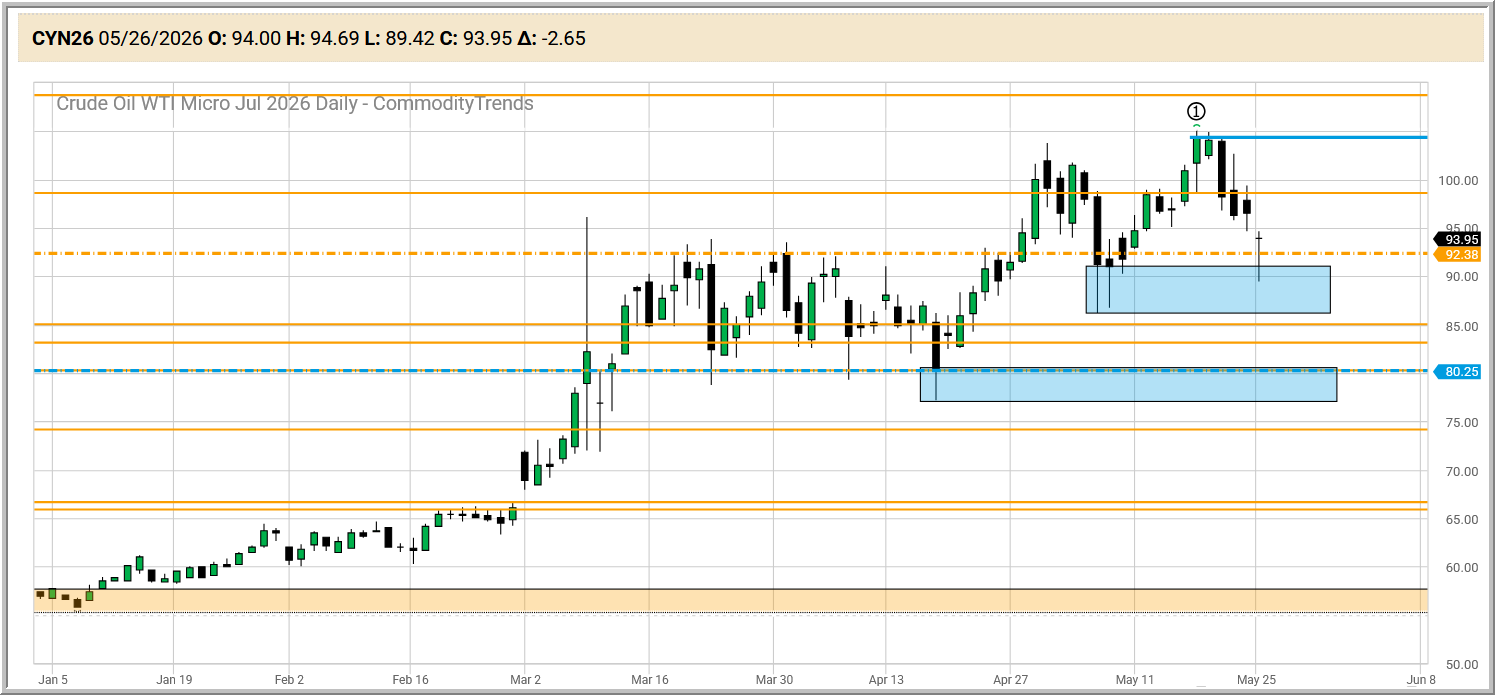
The level I'm watching is the broad shelf I have marked on the daily chart in the blue daily zone — for example, the mid-$80s to the low-$90s area. That's the line that separates "healthy pullback inside a strong uptrend" from "the trend is changing character." If price holds that area and keeps building structure, the bigger uptrend is still intact. If it loses that level cleanly, the picture starts to shift.
Same chart. Two very different stories. The difference comes from how price behaves at one well-defined level — not from how loud today's headline was.
July RBOB Gasoline (RBN26)
July RBOB last traded near $3.20 a gallon, down sharply on the day. RBOB is the contract that follows the unleaded gasoline most of us pump into our cars all summer long.
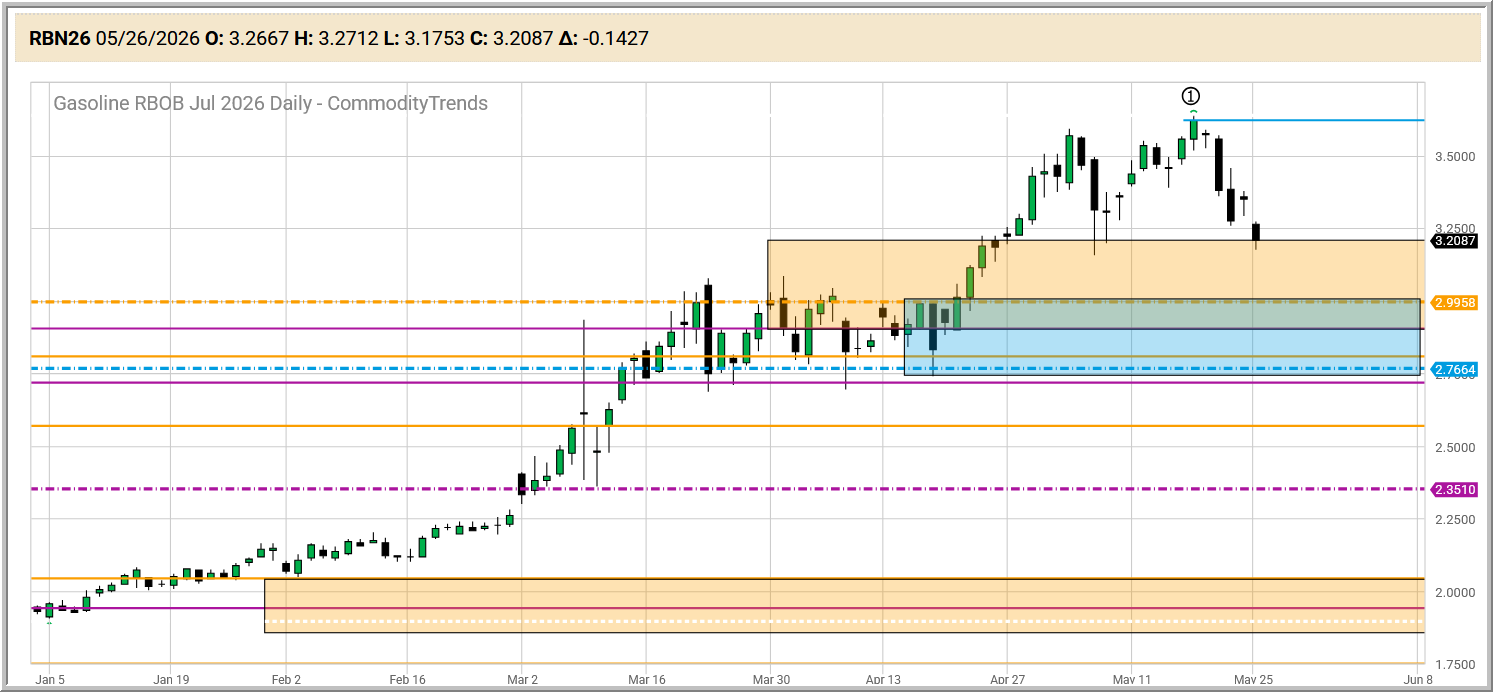
Today's pullback is the kind of dip that comes when a market needs to catch its breath. The level I'm watching underneath is the weekly chart 50% level at 2.9958. That's the spot where buyers showed up previously in April. If they show up there again, the bigger move is still alive. If they don't, the character of the move begins to change.
Either way, the chart will tell us. That's what charts are for.
July Heating Oil / ULSD NY Harbor (HON26)
July Heating Oil — officially called ULSD, which stands for "ultra-low sulfur diesel" — last traded near $3.67 a gallon. The contract made a new high at $4.0791 just last week. Today's drop puts price back at a two-week low. And you can see that price dipped into my daily chart wick zone (blue rectangle) and to the weekly chart 50% level (gold dashed-dotted line).
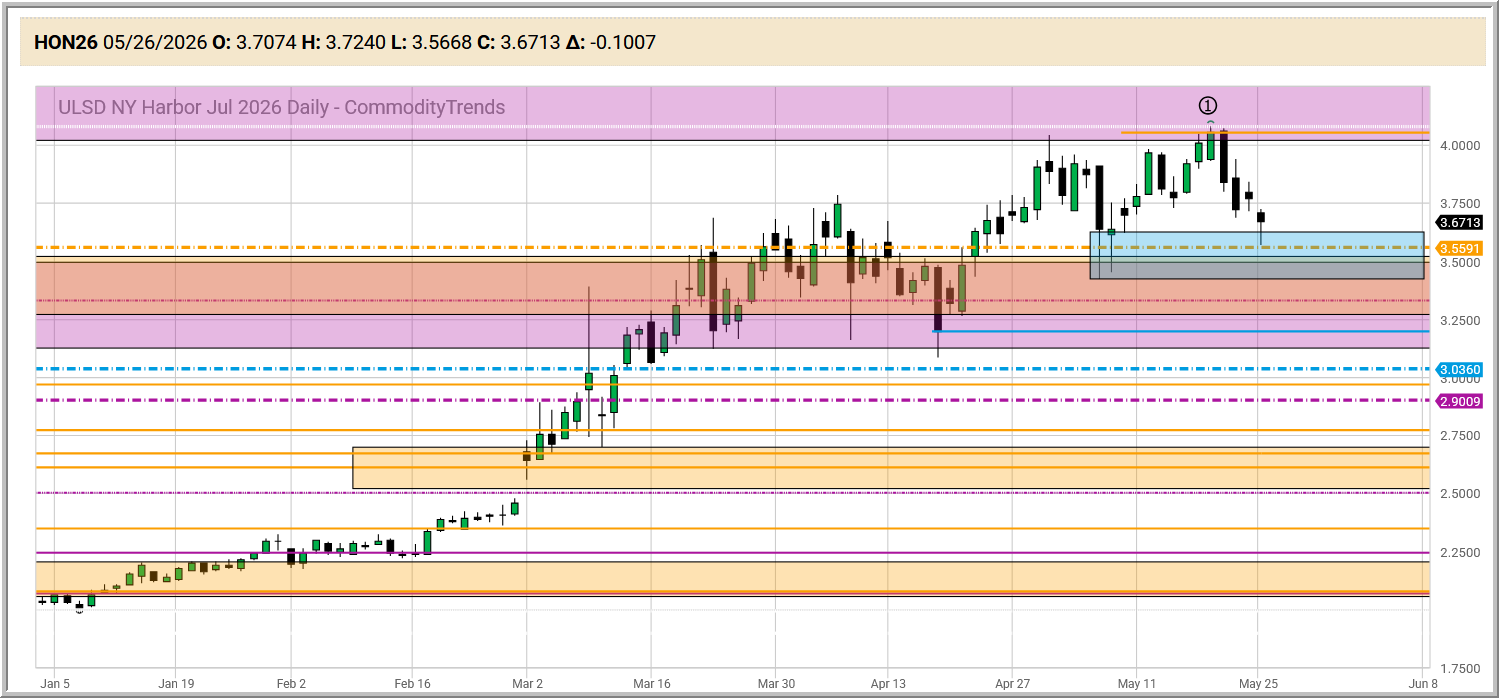
Heating oil tends to move with crude because both products come from the same barrel of oil. So most of what's happening here is the same story we just walked through in crude — peace headlines, fast repositioning by traders. The question is the same too: can price hold the area that turned it higher in the first place?
My blue daily zone sits just above the large gold weekly/purple monthly chart zones that overlap. That's the area I'm watching most closely. As long as price holds above it, the bigger picture is the same as it was last week. Below it, the tone changes.
July 2026 Natural Gas (NGN26)
Natural gas has its own story. While crude oil, gasoline, and heating oil are all tied to the global oil market, natural gas runs on a different set of drivers — weather, storage levels, U.S. production, and LNG exports overseas. That's why it can move in its own direction on days like today.
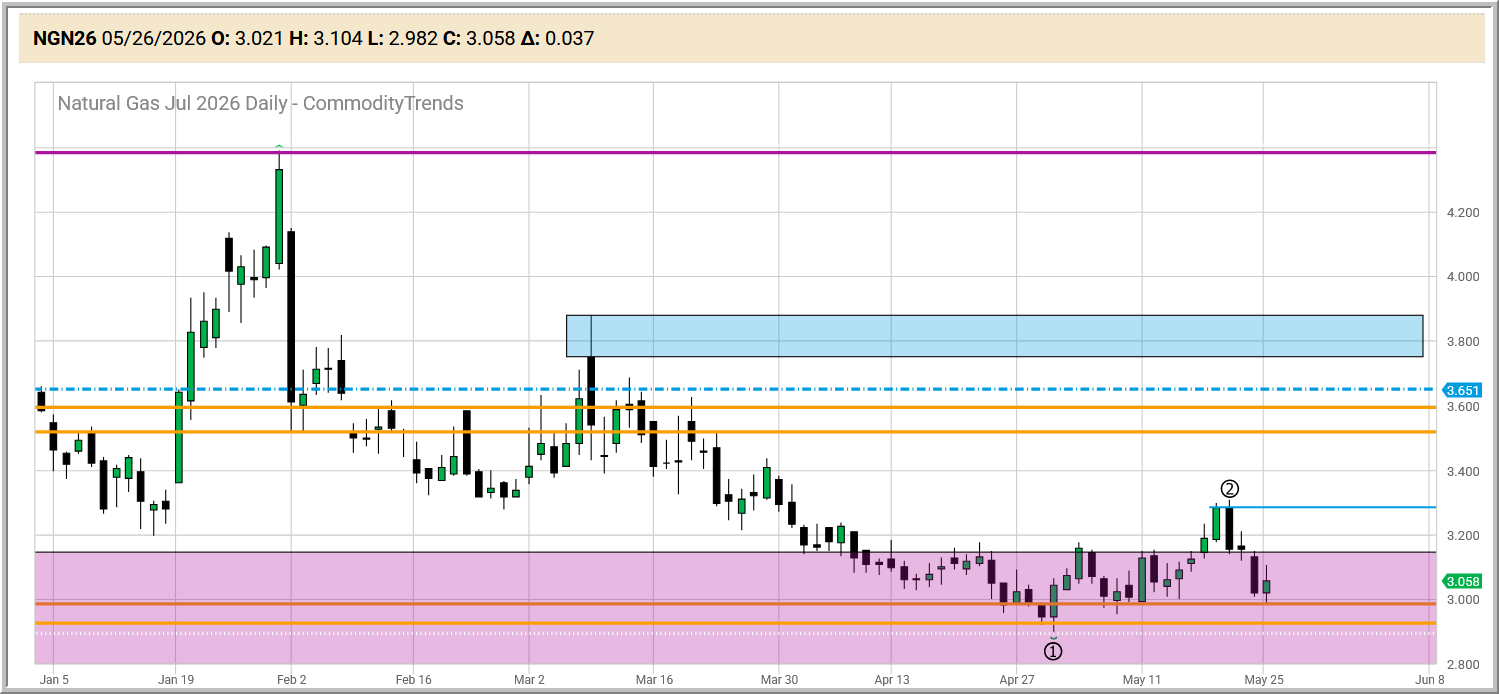
July natural gas has been working through a sideways stretch in the 2.893 to the $3.30area. It's here you'll notice that both #1 and #2 bottom points have developed in or near the monthly chart (purple) support zone.
Anyway, there are two things that put this market in the spotlight right now.
First, the Atlantic hurricane season begins Monday, June 1. Storms in the Gulf of Mexico can shut down offshore natural gas production and slow LNG export terminals. The market starts to pay attention well before the first real threat shows up.
Second, this year's forecast is a little friendlier than recent years. Colorado State University expects 13 named storms and 6 hurricanes. AccuWeather is calling for 11 to 16 named storms. A developing El Niño weather pattern is one reason the forecast is a touch softer — El Niño tends to create wind shear that can break apart storms before they grow.
That's helpful background. It doesn't tell us where price is going. But it helps us understand the backdrop this market is trading against. When a storm starts to form later this summer, traders will move fast. Knowing the seasonal setup ahead of time means we're not surprised when the action shows up.
The Common Thread
Four energy markets. Three of them dropped sharply on a single peace-talks headline. One of them is starting to look at the weather. And every single one is sitting at a level that actually matters on the daily chart.
That's not a coincidence. That's just how markets work. They run. They reach. They pull back. And they test. The job of the chart is to tell us where the test is happening. The job of the trader is to have a plan before the test begins.
This is exactly the moment a defined process earns its keep. When a market is roaring, sloppy decisions can get bailed out by the trend. When a market pulls back to a key level like today, the difference between traders who know their levels and traders who are guessing shows up in a hurry. The whole point of the way we teach is to take the guessing out of it — levels you can see right on the chart, entries and exits you can explain, and risk defined before you click the mouse, not after.
Headlines start moves. Charts finish them. As I said back in April: the first move gets attention. But the next move tells the truth.
I'll keep tracking these markets in the daily videos and in the Friday Markets Jim Is Watching weekly email, and I'll have more of these market check-ins right here on the blog. If you're new here and you'd like to see how we read these same charts in real time, that's what the membership is built for — but there's plenty to learn right here on the blog, too, no strings attached.
Bookmark the page. More market notes are on the way.
Questions about anything you read here? Reach our team at
— Jim Prince, CommodityTrends.com ---
Educational content only. Futures and options trading involves substantial risk of loss and is not suitable for every investor. Nothing here is a recommendation to buy or sell any contract. Past performance is not indicative of future results.