
Grain Markets Check-In: A Hot Complex Takes a Breather
A look at the daily charts in corn, soybeans, soybean oil, wheat, and oats as of the close on May 20, 2026.
If you only glance at today's prices, you'd think the grain markets had a rough day — and they did. Corn, soybeans, soybean oil, wheat, and oats all are trading lower. But one of the first habits I try to pass along to traders is the discipline of separating a down day from a downtrend. Step back to the daily charts, and the bigger story across the grain complex is more interesting than a single red day: these are markets that have had a strong, multi-month run off their winter lows and are now pulling back into levels that matter.
That's where the work happens. Anyone can watch a market go up. The traders who last are the ones who know what they're looking at when the easy part ends and price comes back to test the people who bought it. Let's walk the board.
Corn (July — ZCN26)
July corn last traded at 464¼, down 11 cents on the day. Zoom out on the chart though, and you can see what's really going on. From the January low near 435, corn moved steadily higher into early May, tagging the 488 area. Over the last couple of weeks it has rolled over, slipping back beneath the 480 shelf and now probing the 458–465 zone — a band that has acted as a pivot before, with a defined line right around 458.
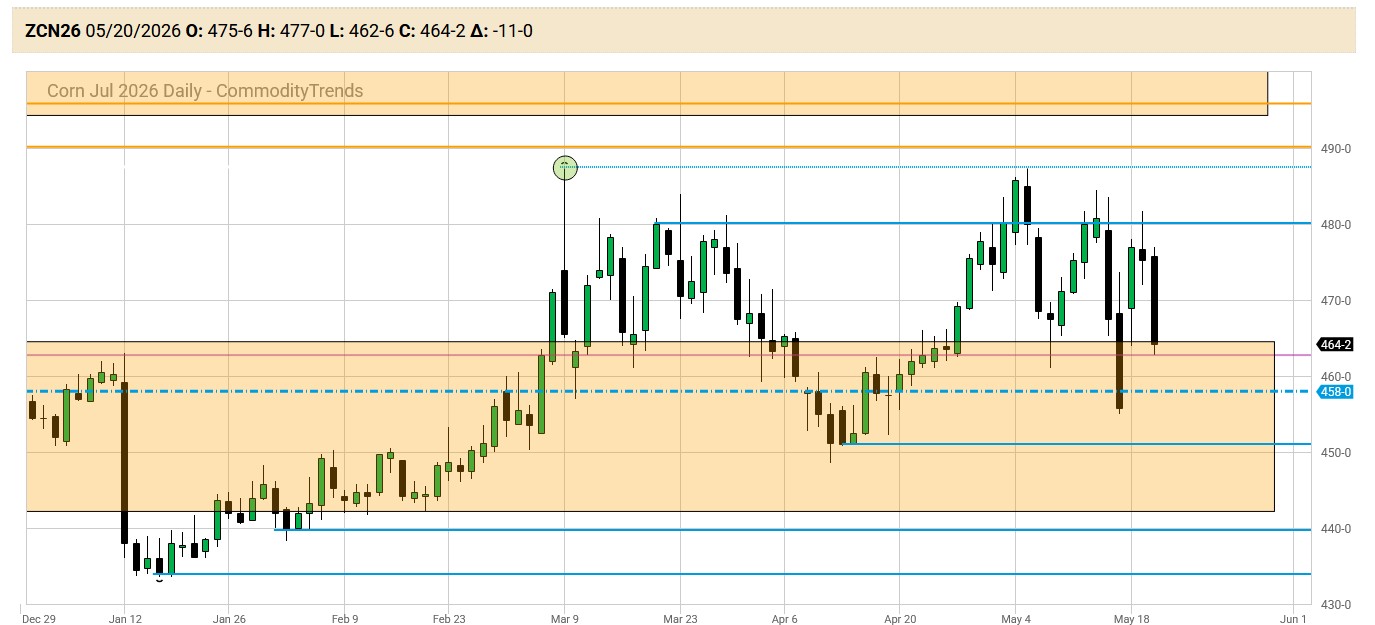
That 458 area is the level I'm watching. If it holds it on a pullback and the broader uptrend is still very much intact. If it loses it decisively the character of this market starts to change. Same chart, two very different stories depending on how price behaves at one well-defined level. I'd even go so far as to say price is stuck in a large range. Time will tell.
Soybeans (July — ZSN26)
July soybeans last traded at 1198, down 11½ cents. Beans have been a range-and-rally market this year: a climb from roughly 1075 in January to about 1240 in early March, then a long digestion phase through March and April inside a 1161–1200 band, and then a fresh push back toward the May highs near 1230. Today's pullback drops price into the upper end of that old range.
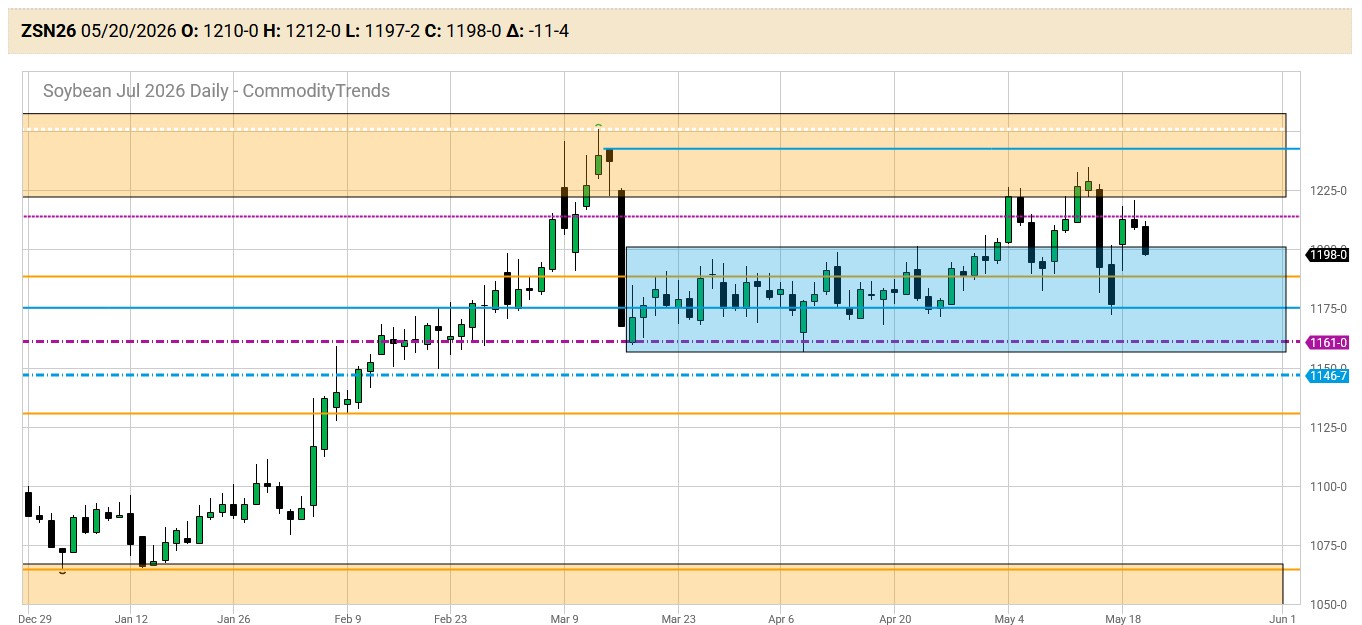
So the 1161 area sits below as the floor of the prior range, and the 1225–1240 shelf stands above as the ceiling buyers have to clear. Until one of those levels gives way, I'm happy watching from the sidelines.
Soybean Oil (July — ZLN26)
Of the five markets on the board, July soybean oil has the cleanest uptrend by a wide margin. It last traded at 74.65, off 0.79 on the day — but look at the runway behind it: a near-uninterrupted climb from the low 50s over the winter to the mid-70s now. Right now it's simply consolidating just under its highs, which is exactly what healthy up-trends tend to do.
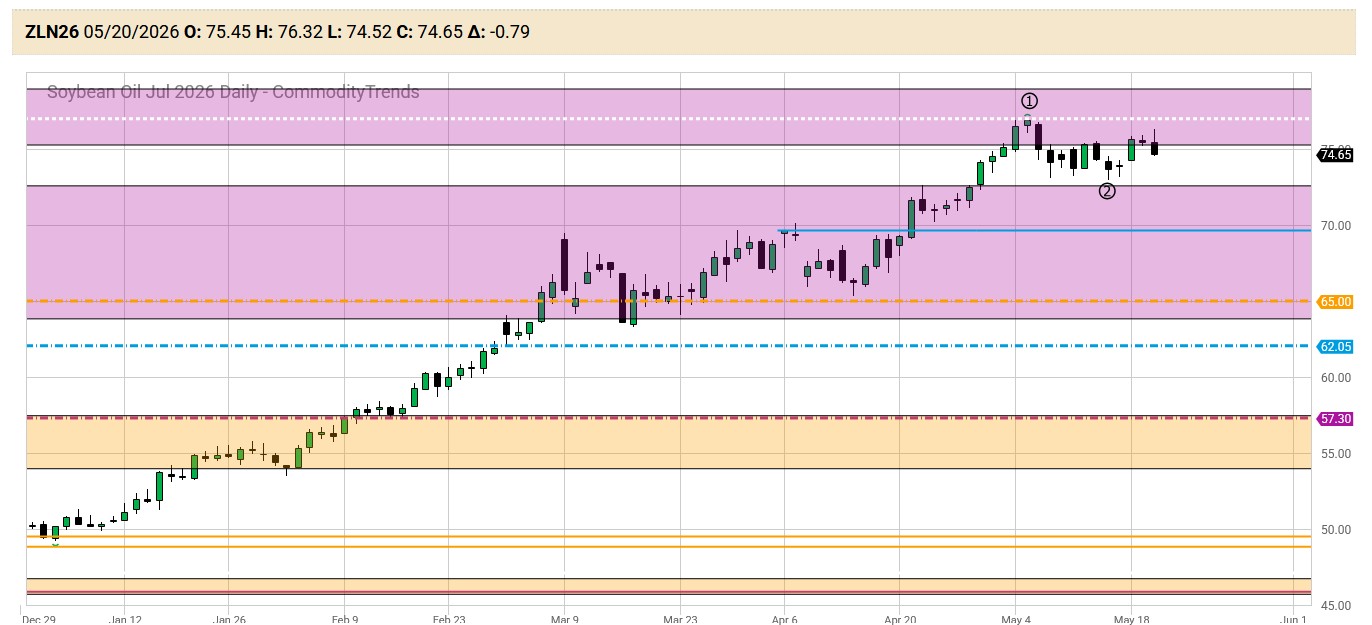
The structure markers on the chart reflect my methodology flagging the shape of this advance as it developed. The line that matters underneath is the prior breakout of the former monthly chart resistance zone near 70 — the level that, if it ever gets tested, tells us whether the trend is just resting or genuinely tiring.
Wheat (July — ZWN26)
July wheat last traded at 658, down 9¼ cents. Wheat has quietly been one of the better movers in the complex, climbing from the December low near 535 to a mid-May high around 680. My chart points out that high as a potential reaction high, and price has since eased back toward the 658 area.
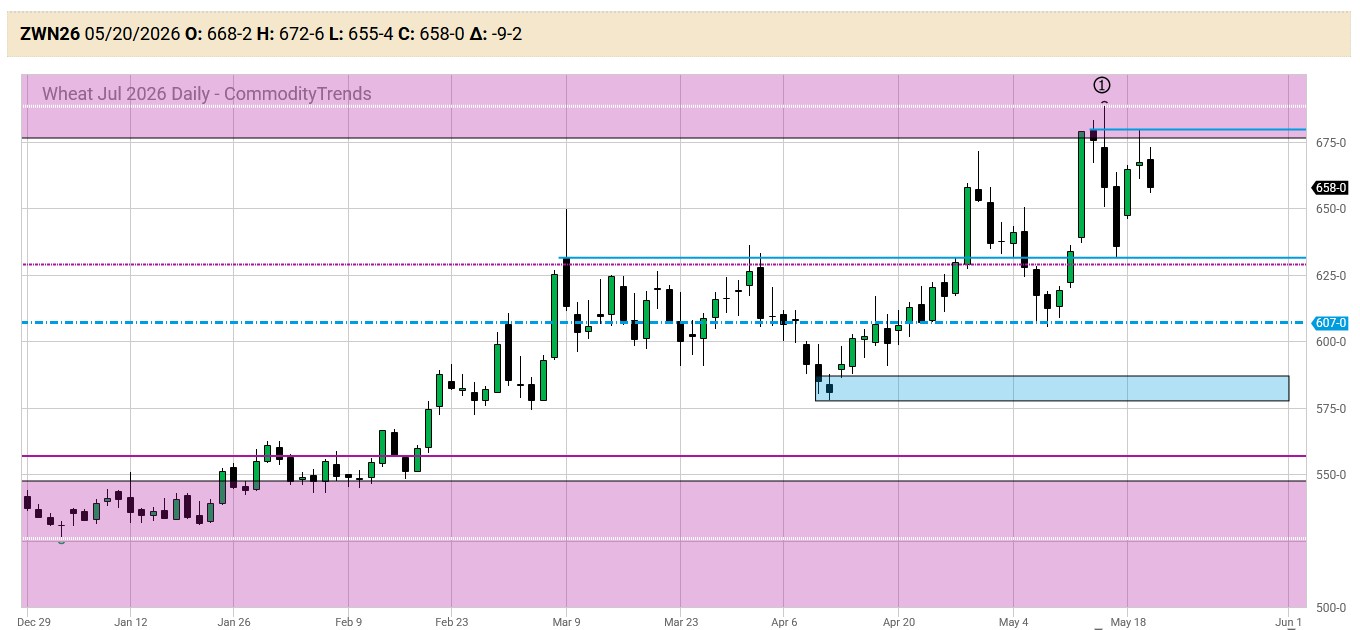
Wheat is a market that loves to fake trader's out in both directions, so I treat its rallies and its dips with the same patience. The question on this pullback is the same one running through the whole complex: do buyers step back in where they should, or can the dip find a floor?
Oats (July — ZON26)
And then there's oats — the wild card. July oats last traded near 364, down a sharp 17 cents, one of the biggest percentage movers on the board today. Oats are thin, fast, and prone to exactly this kind of whipsaw: after spiking to new highs near 390 yesterday, the market reversed hard and is now back down trading inside my consolidation zone around 363.
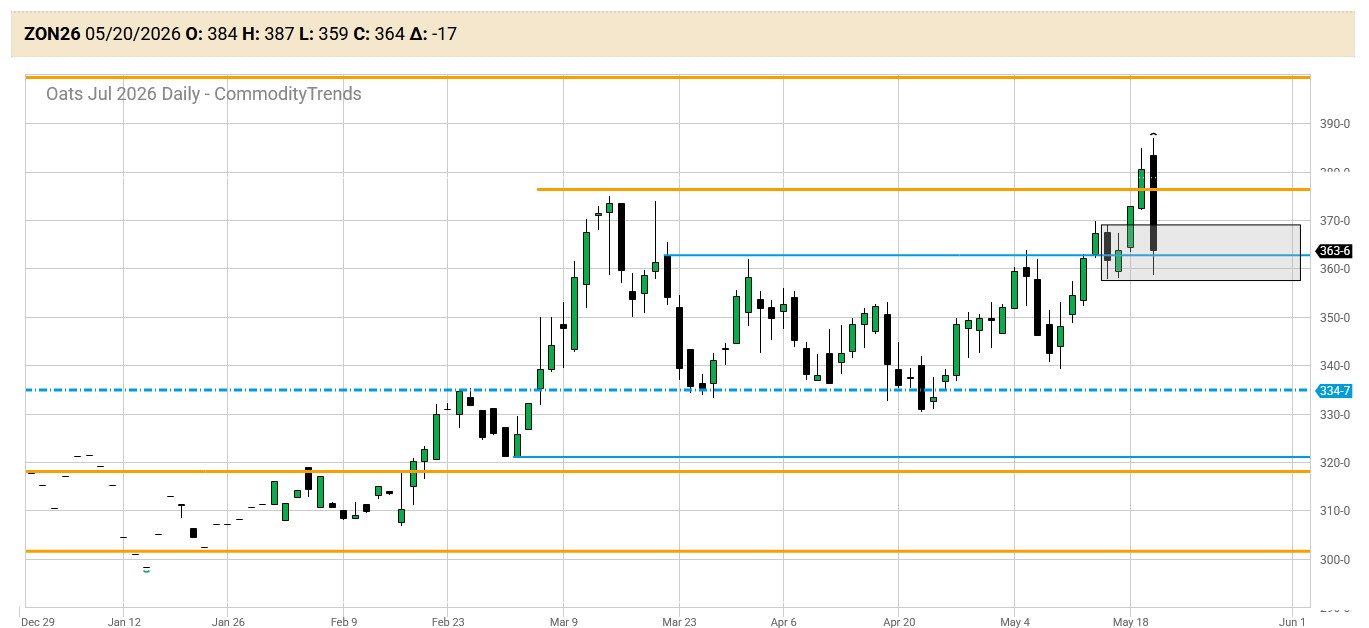
I include oats here as a teaching point as much as a market. Thin markets giveth and taketh away. They can hand you an outsized move and then take it right back before you've had your coffee, which is precisely why position size and defined risk matter more in a market like this, not less.
The Common Thread
Here's what ties all five charts together: every one of them had a strong run, and every one of them is now pulling back to a level that actually means something. That's not a coincidence — it's just what markets do. They trend, they reach, they pull back to test, and they make you decide.
This is exactly the moment where having a defined process earns its keep. When a market is roaring, sloppy decisions get bailed out by the trend. When it pulls back to a key level like this, the difference between traders who know their levels, their risk, and their plan — and traders who are guessing — shows up in a hurry. The whole idea behind the way we teach is to take the guessing out of it: levels you can see on the chart, entries and exits you can explain, and risk defined before you click the mouse, not after.
I'll keep tracking these markets in the daily videos when appropriate and the Friday Markets Jim Is Watching weekly email newsletter. If you're new here and you'd like to see how we read these same charts in real time, that's what the membership is built for — but there's plenty to learn right here on the blog, too, no strings attached. Bookmark the page; I'll have more market notes like this one going forward.
Questions about anything you read here? Reach our team at support@commoditytrends.com.
— Jim Prince, CommodityTrends.com
Educational content only. Futures and options trading involves substantial risk of loss and is not suitable for every investor. Nothing here is a recommendation to buy or sell any contract. Past performance is not indicative of future results.