
Grain Market Check-In: Corn, Soybeans, Wheat, Soybean Oil & Soybean Meal (July 7, 2026)
Welcome back. It’s the first full trading week of July — the heart of the weather market. Corn is pollinating. Beans are setting pods. The old-timers say, “Corn is made in July,” and they’re not wrong.
Now let me be honest with you. I had this very check-in drafted a few days ago, and the story was a sleepy one — a whole complex sitting quietly near its lows, waiting. Then I didn’t get it posted. And wouldn’t you know it, the grains decided to wake up before I hit publish.
What lit the match? Three things, all at once. China’s Commerce Ministry confirmed it’s dropping its 10% tariff on U.S. soybeans and other ag. The USDA came out with an acreage report that put wheat plantings at the lowest in its records going back to 1919. And the extended forecast turned hot and dry through mid-July, so the market finally added some weather premium. The grain quote board gapped higher Sunday night and if you saw my Daily Video on Monday you know that beans exploded! Follow-through carried into today.
Here’s the thing, and it’s the whole point of this post. I didn’t have to see any of those headlines coming. The charts were already sitting on the levels that mattered. When the news broke their way, the move was right there waiting. Let the charts do the talking.
December 2026 Corn (ZCZ26)
December corn is trading around 457¼ after a string of big green candles. Look back on the daily chart and you can see the whole thing. Corn leaked lower all through June and put in a low near 430 in the last week of the month. On my chart that low is marked point ① — the first leg of what could become a 1-2-3 bottom. From there, price snapped back hard.
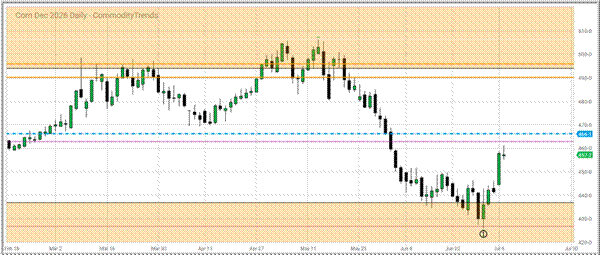
Now, the crop’s in good shape — ratings around 67% good-to-excellent, a touch ahead of average. So far this is a good crop with heavy supply, but price still popped. That’s what a weather scare and friendlier trade picture can do to a market that trader’s had leaned on.
The level I’m watching now is overhead: the BLUE daily chart 50% level at 466-1/8. That’s the nearby ceiling. Corn will need to walk through it to prove this is more than a bounce. Above that, the GOLD weekly level up near 490 is the bigger test. Below, that late-June ① low is the weekly chart support zone this whole move is built on. Same chart, with two stories. The levels/zones will decide which one we’re in.
November 2026 Soybeans (ZSX26)
November beans were the fireworks display yesterday. They jumped about 44 cents on Monday to settle near $11.92 — a five-week high — and pushed a little higher again today. Just last week this market was trading near a four-month low and feeling heavy. One China headline later, they’re at the top of the room. That’s the whacky bean market for you.
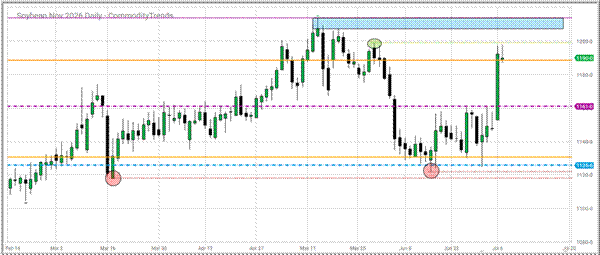
On the chart, price blasted up through the magenta monthly chart 50% level at 1161 line — the middle of this year’s range — and is now trading near the gold weekly chart level at 1188-1/2. Look above and you’ll see a possible magnet. . . that BLUE wick zone up around 1208 to 1214, the shaded band left over from the spring highs. That’s where sellers stepped in last time, and that’s the zone buyers now have to clear.
And remember, beans aren’t even made yet. The crop fills pods in August, so every hot, dry stretch between now and then is a fresh question mark. This is exactly why I don’t short a quiet market just because it looks heavy. The chart held its level. Then the fundamentals showed up. Patience isn’t sitting on your hands — it’s waiting for the chart to talk.
December 2026 Wheat (ZWZ26)
December wheat is trading around 631. Wheat’s been the sad sack of the complex all spring, beaten down by a fast, clean harvest. But the USDA just handed it a real spark: wheat acreage came in at the lowest in the agency’s records going back to 1919 - record low! That’s the kind of number that puts a floor under a market nobody wanted.
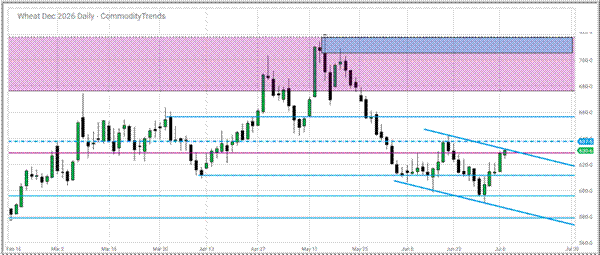
You can see it on the chart. Wheat bounced off the 595–600 area in late June, climbed up out of the little down-sloping channel it had been stuck in, and is now pressing the BLUE 637½ line. That’s the first door. Above it, the 658 level is the next stop, and the PURPLE monthly resistance zone up near 680 to 720 is the big-picture cap that’s been sitting over this market for months.
Here’s what makes wheat wheat: it loves to fake traders out in both directions. For weeks it faked out the bulls. This week it faked out the bears. I treat its rallies and its dips with the same patience — and I let the daily chart 50% level at 637½ tell me whether this bounce has legs.
December 2026 Soybean Oil (ZLZ26)
December soybean oil is trading near 67.41, firming toward the top of the tight box it’s built between about 64.62 and 67½ — the area marked ② on my chart. Of the whole complex, bean oil marches to its own drum, and that drum is biofuel policy, not weather. It’s the main feedstock for biodiesel, and the governments renewable fuel numbers move it as much as anything in the field does.
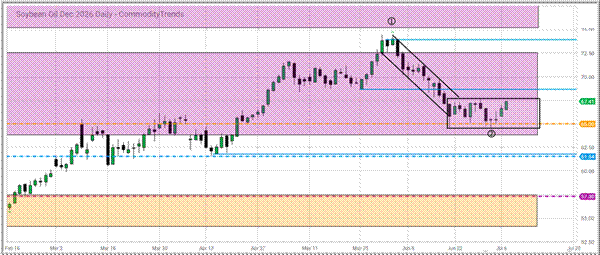
The level I’m watching is the top of that consolidation box. If price clears it, and bean oil rejoins its uptrend back toward the spring highs — that old ① top point at 74.55. If price stays below it we could see a potential 1-2-3 top develop.
December 2026 Soybean Meal (ZMZ26)
And then there’s meal — the quiet member of the family. December meal is trading around 312 after popping to about 316.40 and settling back a touch today. Meal put in a low of its own at 299.10 on June 30. I’ve marked the point with a ① on my chart. Perhaps this is another possible 1-2-3 bottom taking shape.
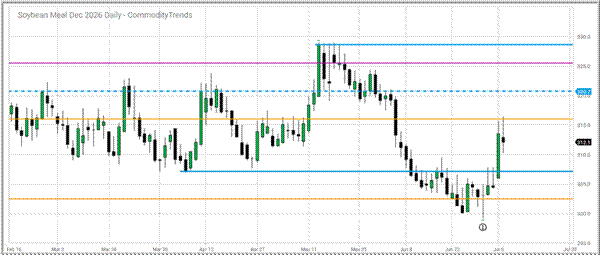
The level I’m watching overhead is the BLUE Daily chart 50% level (horizontal line) up at 320.7, with levels of support near 307 and 302 underneath. A market this quiet is often a market getting ready to move. When it does, I want my levels marked already — not scrambling to find them mid-move.
The Common Thread
Here’s what ties all five charts together, and it’s the whole lesson of the week. A few days ago, every one of these markets was sitting quietly on a level. I literally had this post drafted calling them sleepy. Then China, the USDA, and the weather all showed up at the same time, and the entire board gapped higher.
Now think about what that means. I didn’t have to predict the tariff headline. I didn’t have to guess the acreage number. I didn’t have to nail the forecast. All I had to do was know my levels and let the market come to them. When the snap came, the chart had already shown me where the doors were — overhead and underneath, on every one of these markets.
That’s the difference between trading a plan and trading from the hip. If you chased Monday’s gap on emotion, you paid up and sweated it. If you had your CTTP levels marked and your risk set before the open, you were calm while everybody else was scrambling. PURPLE, GOLD, and BLUE — the monthly, the weekly, the daily — those lines don’t move when the headlines swing. That’s exactly why we lean on them.
The news moved the market. The chart moved me. That’s the whole game — and it’s why the patient trader eats last but eats best!
I’ll keep tracking these markets in the daily videos and the Friday “Markets Jim Is Watching” weekly email newsletter. If you’re new here and want to see how we read these same charts in real time, that’s what the membership is built for — but there’s plenty to learn right here on the blog, too, no strings attached.
Questions about anything you read here? Reach our team at support@commoditytrends.com.
— Jim Prince, CommodityTrends.com
Educational content only. Futures and options trading involves substantial risk of loss and is not suitable for every investor. Nothing here is a recommendation to buy or sell any contract. Past performance is not indicative of future results.