
A daily-chart walk through live cattle, feeder cattle, and lean hogs in the heart of grilling season — two markets carving out records, and one that didn't get the memo.
It's late June, just ahead of the July 4 holiday weekend. The grills are fired up from coast to coast, summer driving season is in full swing, and the meat case at your grocery store is doing brisk business. You'd think that with all that demand, every meat market on the board would be marching higher together. Right?
Not so fast.
This is one of those moments that makes the meats complex such a great teacher. Right now we've got cattle — both live cattle and feeder cattle — pushing up near record territory. And we've got lean hogs sitting at a five-month low, missing the summer rally the calendar said it was supposed to get. Same season. Same grill. Two very different stories. Let's step back from the noise and walk the daily charts the way we do it here — PURPLE for the monthly picture, GOLD for the weekly, BLUE for the daily — and let the levels do the talking.
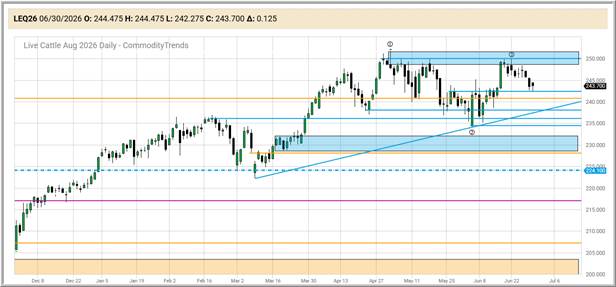
August 2026 Live Cattle (LEQ26): A Record Market Catching Its Breath
August live cattle settled around 243.575 on Monday, down about 2.250 on the day. One red day. But zoom out to the bigger picture and the story isn't a sell-off — it's a market that has spent all of 2026 grinding to brand-new all-time highs, with cash cattle clearing 250 in some regions for the first time ever.
Why is this market so strong? Quite simply: there just aren't many cattle. The U.S. herd is about as small as it's been in generations, and a screwworm scare down in Texas earlier this month gave the supply story another shove. When supply is this tight, a down day doesn't mean much. It's the kind of pullback a strong market gives you to shake out the folks who chased it.
Here's where the chart work comes in. On the daily, the zone I'm watching straddles the 230.000 area — it’s the zone any significant pullback needs to respect if the bigger uptrend is going to stay healthy. Up above, is the #1 top point at 251.650 is the ceiling buyers have to clear to prove the run isn't done.
You don't have to predict which way it breaks. You just have to know your levels before price gets there. That's the whole game.
August 2026 Feeder Cattle (GFQ26): The Strongest Chart on the Board
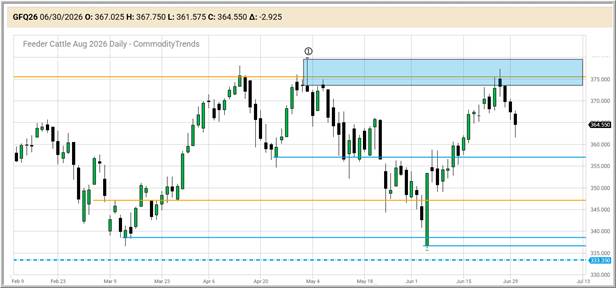
If live cattle is strong, feeder cattle is the runaway leader of the whole complex. August Feeder Cattle printed a high at 377.400 on June 25 — as futures were on a tear!
What's driving it? Math, mostly. When the U.S. suspended cattle coming up from Mexico over the screwworm worry, it pulled an estimated 1.2 million feeder cattle out of the supply chain in one stroke. This means there are fewer animals to fight over the same hungry feedlots.
The June rally took price right into my blue wick zone and up against a gold weekly chart resistance level. This combination of resistance has since pushed prices back down.
A word of caution, though. Feeder cattle is a thin, fast market. It can hand you an outsized move and snatch it right back before your coffee's cold. That's not a reason to avoid it — it's a reason to size smaller and define your risk before you enter a trade setup, not after. Remember this. . . Thin markets giveth, and thin markets taketh away.
August 2026 Lean Hogs (HEQ26): The Rally That Didn't Show Up
And now the wild card. While the cattle were busy making history, lean hogs went the other way. The front month declined to a weekly chart support level — roughly a seven-month low — right in the middle of grilling season, which is exactly when hogs are supposed to rally.
So what happened? Demand was just okay, not great. Pork on the shelf stayed plentiful — hog weights didn't trim down the way they usually do into summer, so there was simply more pork to move.
Here's the teaching point I want you to chew on: the calendar is a clue, not a command. "Hogs rally in summer" is a tendency, not a guarantee! A tendency tells you where to look. The chart tells you what's actually happening. When the two disagree, you trust the chart every single time. Traders who bought hogs in May just because "it's grilling season" learned that lesson the hard way.
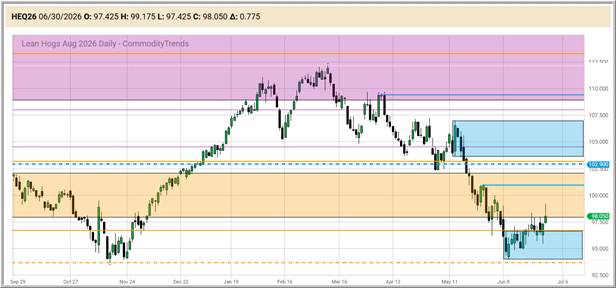
On the daily chart, the zone I'm watching is the blue one just below the current price action. If price can carve out a base and hold there, a beaten-down market can potentially set up a 1-2-3 bottom or a Fish Hook entry down the road. If it can't, well — a market that won't rally when it's supposed to is telling us something. Either way, I'm not going to guess. I'm watching the zone and letting hogs show their hand.
The Common Thread
Three markets, one grill, two completely different charts. Cattle near records because the animals just aren't there. Hogs at a low because the freezer's still full. And the calendar — grilling season — that "should" have lifted all three? It lifted some and skipped one entirely.
That's the lesson I want you to carry out of here today. The season, the headline, the thing "everybody knows" — those are starting points, not trading plans. The plan lives on the chart: levels and zones you can see, entries you can explain, and risk that can be defined before ever placing an order. When cattle and the hogs go their separate ways in the same week, the trader who knows his zones and levels barely blinks. The trader who was leaning on the calendar can get whipsawed.
Trade the chart in front of you. Let the season be a clue, never a crutch.
I'll keep tracking the meats in the daily videos when there's something worth showing, and in the Friday *Markets Jim Is Watching* weekly email. If you’re new here, be aware that our membership is built to show you how we read these same charts in real time — but there's plenty to learn right here on the blog, no strings attached. Bookmark the page; more market notes are on the way.
Questions about anything you read here? Reach our team at: support@commoditytrends.com.
— Jim Prince, https://www.commoditytrends.com/
*Educational content only. Futures and options trading involves substantial risk of loss and is not suitable for every investor. Nothing here is a recommendation to buy or sell any contract. Past performance is not indicative of future results.*