
Metals Market Check-In: Gold, Silver, Copper & Platinum (June 8, 2026)
A walk through the daily charts in gold, silver, copper, and platinum on a Monday when the headlines screamed one thing and the metals did another.
Open your news app this morning and you'd expect the metals to be flying. Missiles traded over the weekend in the Middle East. Israel and Iran back at it. That's the kind of headline that's supposed to send gold straight to the moon and drag silver up with it.
August 2026 Gold (GCQ26)
So what happened? Gold opened lower. Silver opened a lot lower. Funny how that works, isn't it?
This is the exact lesson I keep coming back to. The headline tells you how you're supposed to feel. The chart tells you what's actually happening. And when those two things disagree, the trader who's been doing this a while learns to trust the chart. June isn't a big "season" for metals the way harvest is for grains — no planting, no driving season. What moves this complex is money: where the world parks it when it's scared, and where the world spends it when it's building things. Let's walk the board.
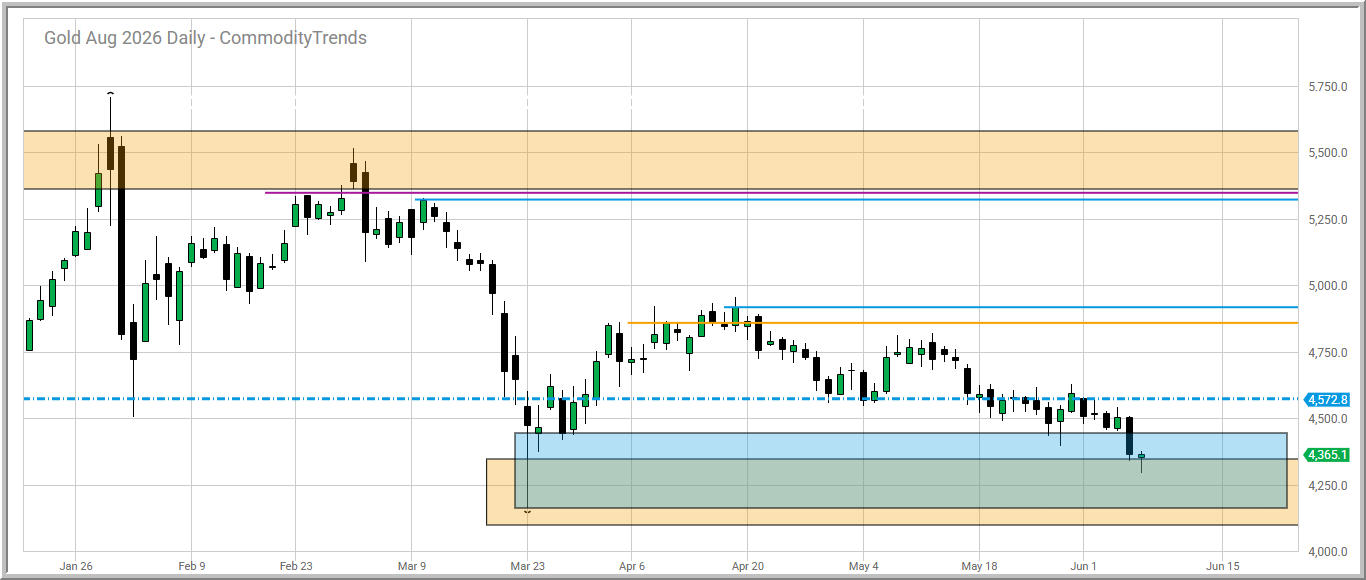
August gold last traded around $4,358 an ounce, slipping to start the week and sitting near its lowest levels of 2026 after dropping close to 4% last week. Now stop and think about that for a second. We had a weekend full of scary headlines, and the world's favorite safe haven is lower. Big trouble? No. Just a reminder that markets often price in fear long before the news ever prints.
Here's the bigger picture, and this is where my color zones earn their keep. Step back to the PURPLE monthly chart and gold has had a tremendous multi-year run — nobody's arguing with that trend. Drop down to the GOLD weekly, and you can see this pullback is happening inside a market that climbed a very long way. Then come to the BLUE daily (see above), where the day-to-day action lives, and you've got a market backing off its highs and testing the people who bought up there.
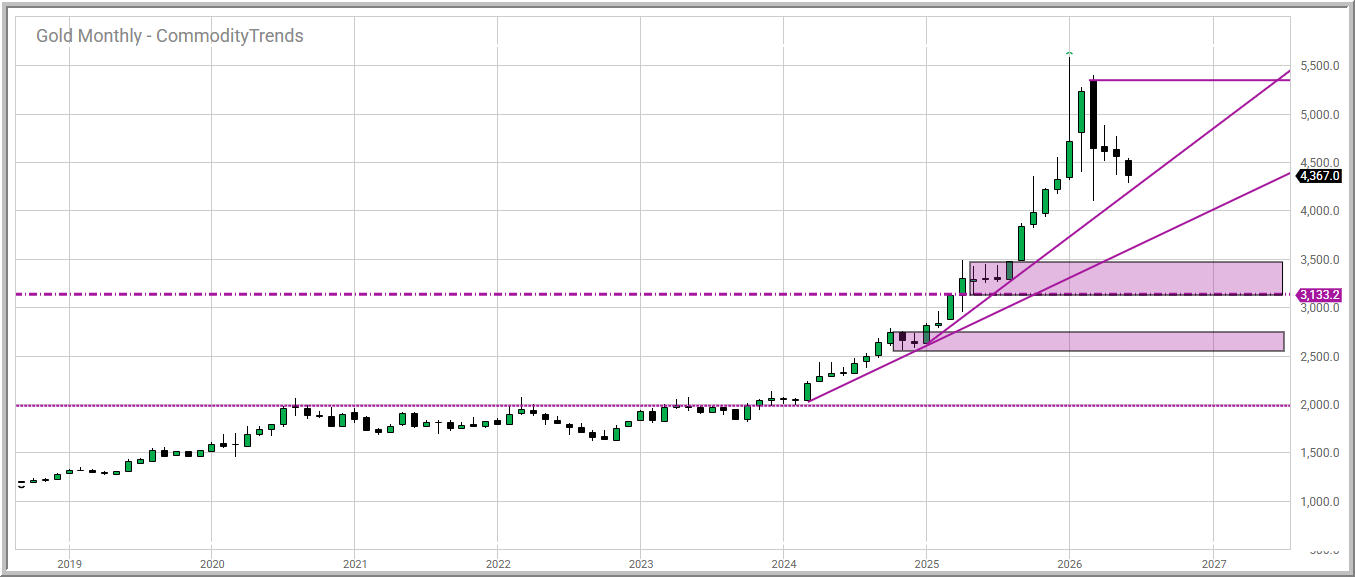
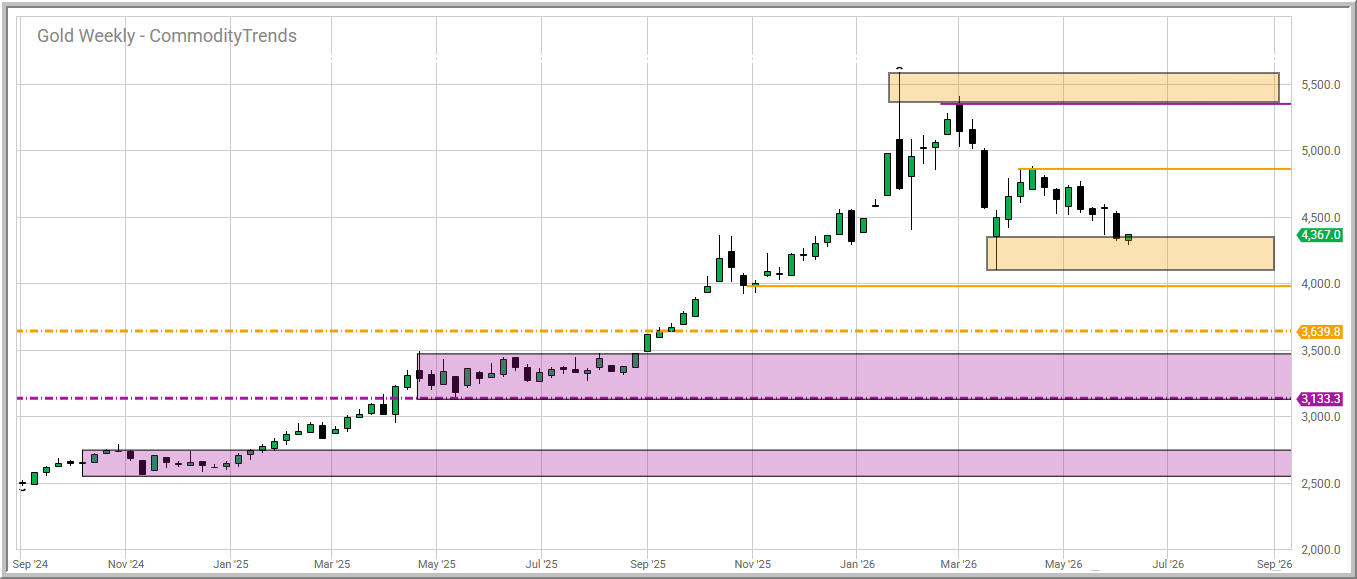
The level I'm watching is the weekly chart wick support zone that price is currently touching. If gold settles back into that zone and finds buyers, this is a pullback in an uptrend, plain and simple. If it slices through [fill in your gold daily line-in-the-sand level here] and keeps going, the character changes. Same chart. Two stories. The level decides which one we get.
July 2026 Silver (SIN26)
July silver was the loud one today, opening near $67.84 and down close to 2% — its lowest since late March. But don't let one rough morning fool you. Silver has more than doubled this year. Doubled! A market that runs that hard has earned the right to catch its breath, and that's what a pullback like this usually is.
Silver is the wild child of the precious metals family. It's thinner than gold, it's faster, and it loves to overshoot in both directions. When it rallies, it rallies harder than gold. When it pulls back, it pulls back harder too. That's not a flaw — it's just silver being silver. You size your position for that personality, or it sizes you.
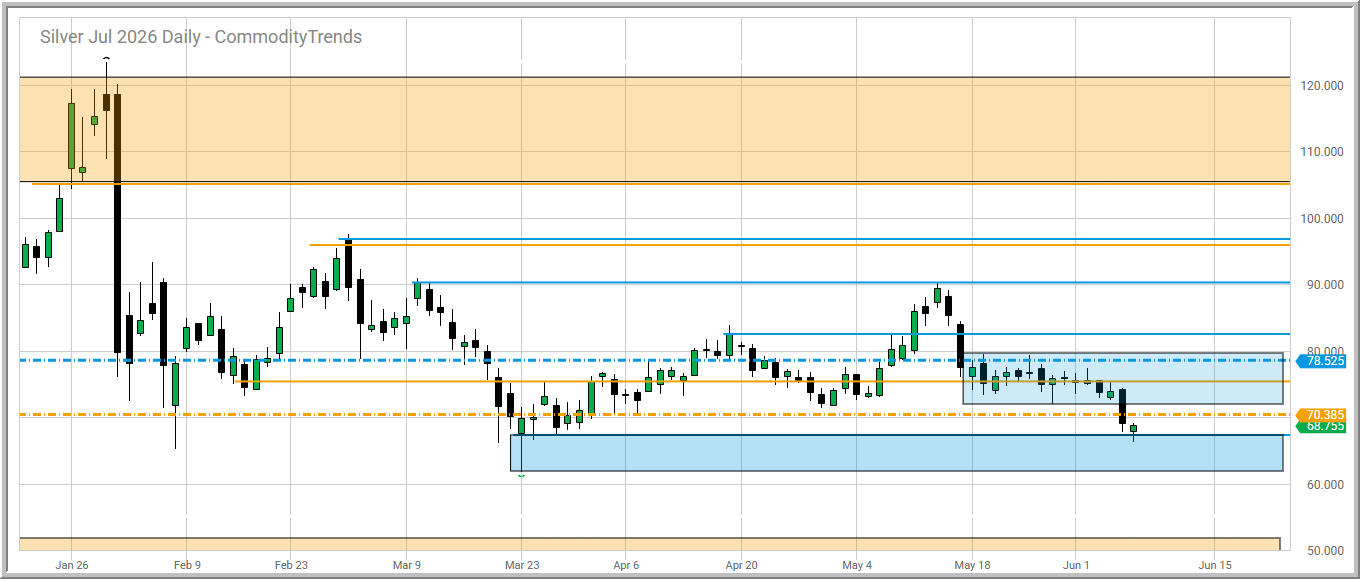
On my daily chart, I'm watching whether this dip holds the blue wick zone at 67.145 down to 61.660. A clean hold there, and I start watching for a possible Fish Hook back into the trend. If price breaks and closes below this zone though, I'm content to fold my arms and wait. There's no rule that says you have to have a position. Some of the best trades I ever made were the ones I sat out. 😉
July 2026 Copper (HGN26)
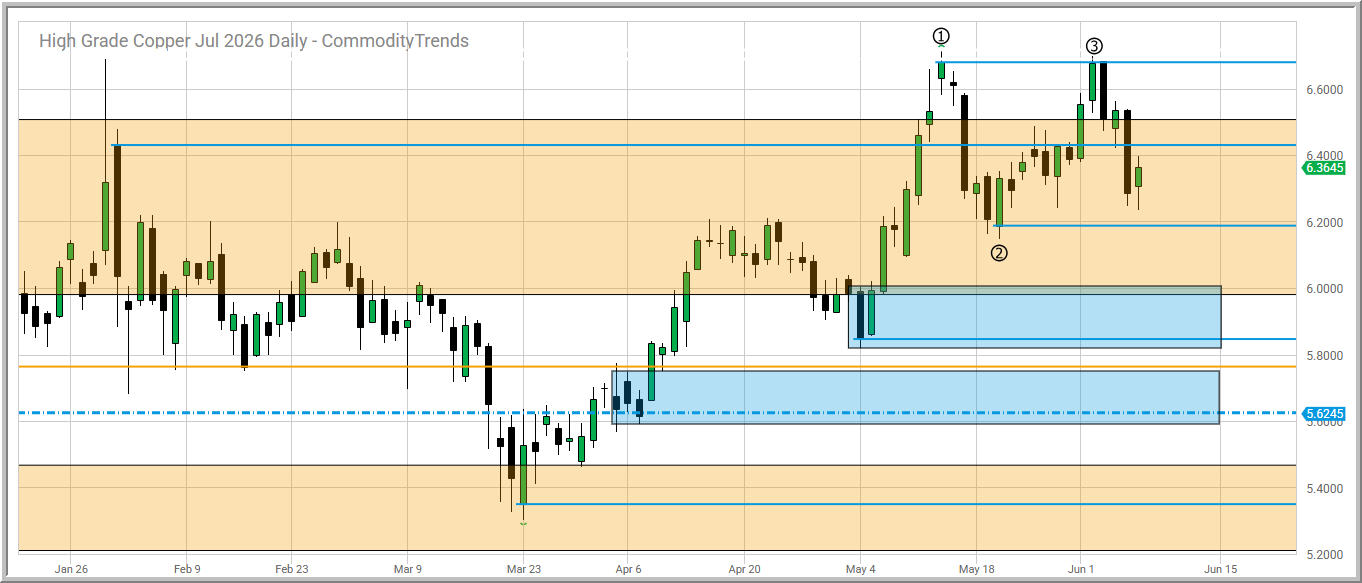
Now flip from fear to building. July copper last traded around $6.36 a pound. Remember, copper printed a record high near $6.7160 back on May 13, so this is a market easing back from the top of its own mountain, not falling off a cliff.
Copper is the metal that builds things — wires, pipes, motors, the whole modern world. So while gold and silver dance to the fear music, copper dances to the growth music. That's why I like watching them side by side. When they all sag together, it tells you something different than when one zigs and the others zag.
On the chart, the line I care about 6.1875 — the support level produced from the opening price of the #2 point. If price comes back to test this level it could tell us whether the uptrend is resting or the trend tiring.
July 2026 Platinum (PLN26)
And then there's platinum — the forgotten cousin nobody talks about at the family dinner. July platinum is trading between the weekly chart 50% level and monthly chart 50% level, currently hovering near March low -- after some real weakness across the whole metals aisle.
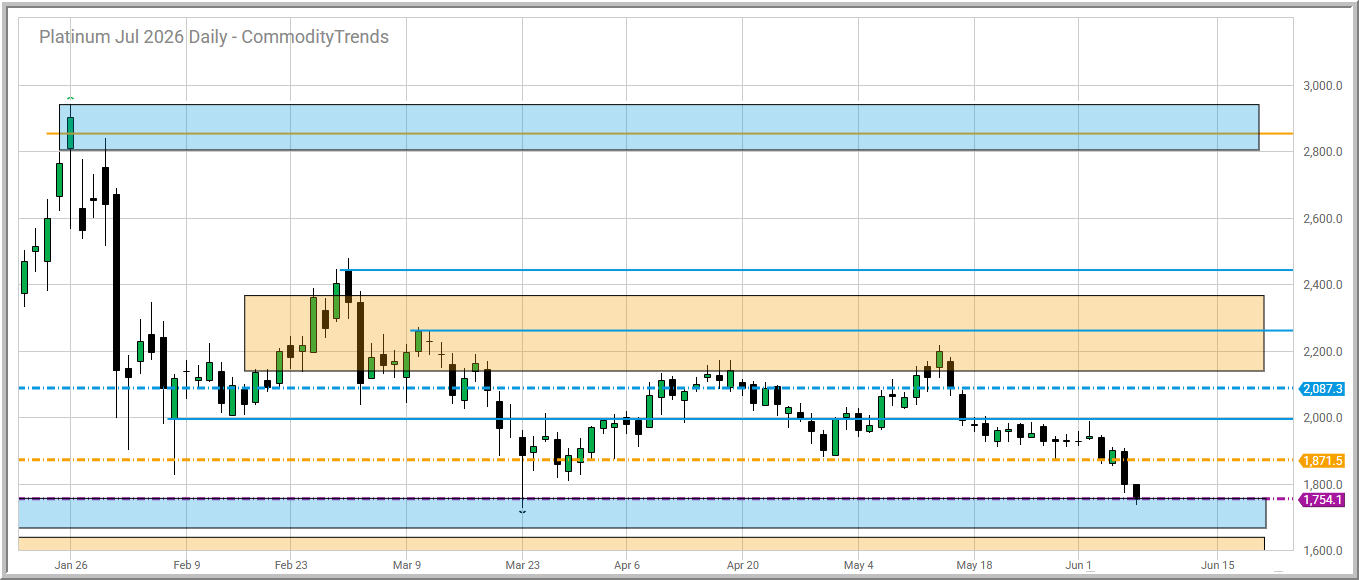
Platinum is a funny animal. Part precious metal, part industrial metal, it gets pulled in two directions at once. That makes it choppy, and choppy markets are where a defined plan matters most. The level I'm watching is the monthly chart 50% level at 1754.1. If price stabilizes there, fine. If it keeps grinding lower toward to fill in the daily chart wick, I want to see how it behaves before I decide anything. Thin, choppy markets reward patience and punish itchy mouse fingers.
The Common Thread
Here's what ties all four charts together today: the news said "danger," and the metals said "we'll do what we want, thank you." Gold moved lower and so did Silver. Copper appears to be easing from a record. While Platinum is near lows. Every one of them backing into a level that actually means something on the chart.
That gap — between what the headline wants you to do and what the chart is actually doing — that's the whole game. Anybody can react to a scary headline. The traders who last are the ones who already knew their levels before the weekend, who had their risk defined before they clicked the mouse, and who let price come to them instead of chasing it.
So don't trade the missiles. Don't trade the fear. Trade the chart in front of you, one defined level at a time.
The headlines will always shout. Your job is to read.
I'll keep tracking the metals in the daily videos when appropriate and in the Friday Markets Jim Is Watching weekly email newsletter. New here? Bookmark the blog — there's plenty to learn, no strings attached.
Questions about anything you read here? Reach our team at
— Jim Prince, CommodityTrends.com
Educational content only. Futures and options trading involves substantial risk of loss and is not suitable for every investor. Nothing here is a recommendation to buy or sell any contract. Past performance is not indicative of future results.