

RDW (Redwire Corp): A Look Back at the Stock We Featured on the May 14 Daily Video
A stock I walked through on our May 14 daily video has moved more than 60% in two weeks. A quick look back at what we saw on the chart, what's happened since, and why patient daily-chart work matters.
Every trading day inside the CommodityTrends membership, I record a daily video for our premium members. I walk through the futures markets and a handful of select equities. I talk about what the daily charts are saying, what setups are developing, and what's worth keeping an eye on.
On May 14, one of the equities I featured was Redwire Corp — ticker RDW — a space infrastructure company.
At the time, RDW was trading in the $14 area. As the time of this writing the stock is at $23.80.
That's a move of more than +63% in about two weeks.
I want to take a few minutes to look back at this one — what the chart was telling us, what's happened since, and what kind of work goes into spotting setups like this in the first place.
What the Chart Was Telling Us on May 14
This is the part I love about chart work. Stories show up on the chart (footprints) well before they show up in the news.
When I featured RDW on May 14, the daily chart was setting up. Price had been quietly building a base and a pattern I watch for was beginning to form. The risk was defined. The bigger picture looked interesting. And the chart was doing the talking — not a headline, not a hot tip from somebody at a barbecue, not a guess.
I'm not going to walk through the specific entry rules or the exact setup type here — that's the kind of detailed work we do inside the membership every day. But the bigger lesson is simple: the chart was speaking. We had to be willing to listen.
What's Happened Since
In the two weeks since the video, RDW has moved sharply higher.
Today alone the stock is up $1.77 on the day. From the $14 area where we walked through the chart on May 14, to the current price at $23.80, the stock is up about $9 per share. That works out to roughly +63% in two weeks.
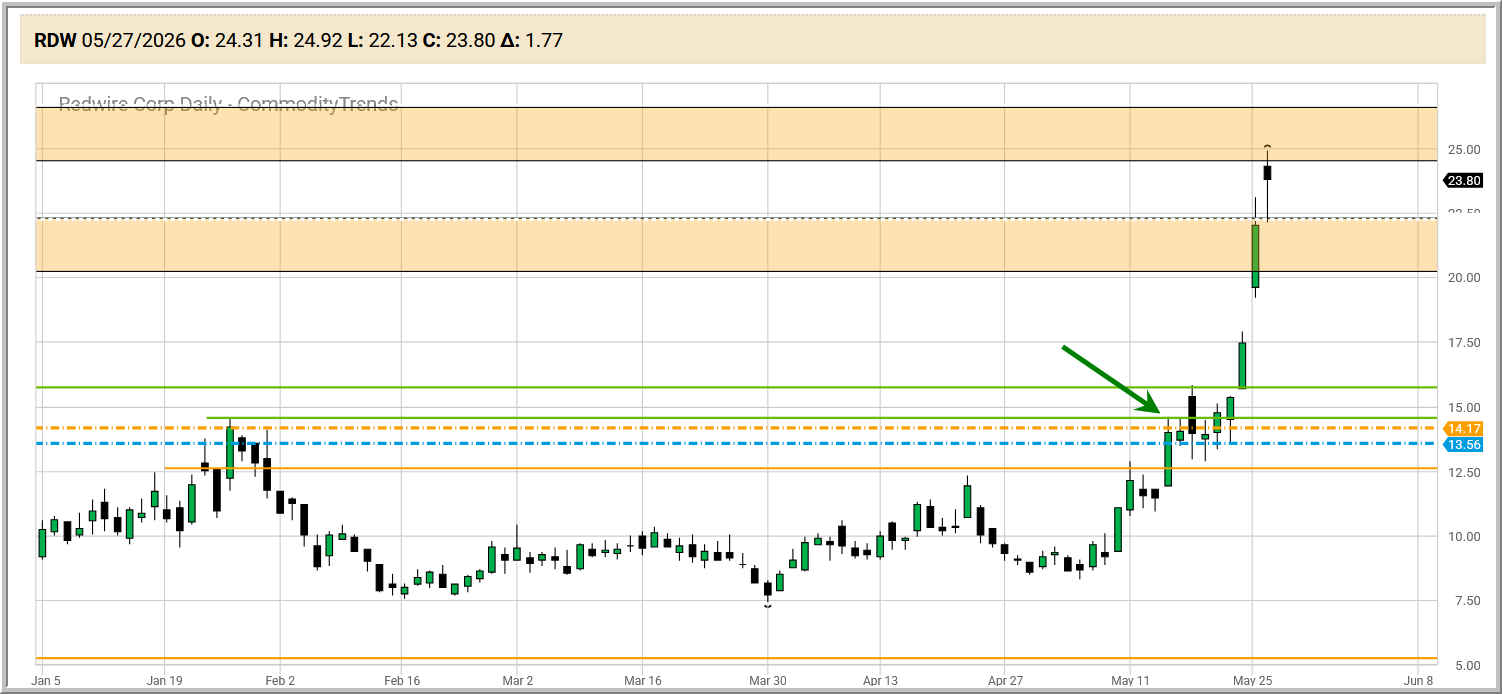
For a relatively low-priced stock, that's the kind of move that gets attention.
Now — let me be very clear about something. One trade is one example. It is not a pattern, a promise, or a prediction. Not every chart/trade works out like this. Some setups fail. Some trades hit their stops. Some pay off quickly. Some pay off slowly. Some pay off in a way that takes weeks or months of patience.
The point isn't that every trade looks like RDW. The point is that when you do the chart work day after day, opportunities show up. Your job is to be ready when they do.
Why I'm Sharing This
I'm sharing this for two reasons.
First, because our members deserve to see when the methodology works. When a setup I walked through moves as anticipated, that's what it's all about.
Second, because I want anyone reading this blog who isn't yet a member to see that real chart work — patient, process-driven, and grounded in the daily chart — can spot real opportunities in real markets. RDW is one example from this month. There have been others before. There will be others to come.
The way to find them is to do the work. That's what I do inside the daily video. Every single trading day.
What I'm Watching From Here
I'm not going to give specific price levels for RDW here — those are part of the daily video analysis our members have access to right now. But I will say this: after a 60%+ move in two weeks, the more interesting question isn't "how high can it go?"
The more interesting question is "how does the chart handle the move?"
Markets that run hard tend to need to catch their breath. They pull back. They test old levels. They show whether buyers are still around. That's where the next chapter of the chart story gets written. And that's what we'll be watching together inside the daily video in the days ahead.
Final Thoughts
Days like today are a fun reminder of why I love the trading business. Not because of the size of the move. But because of what made the move "findable" in the first place — patience, a defined process, and a willingness to trust the daily chart over the noise.
If you've been curious about what we do inside the CommodityTrends membership, today is a good window. The daily video is the heart of it. RDW was one stop along the route. There will be others.
To our members watching this play out alongside me — well done. Stay patient. Keep the process.
— Jim Prince, CommodityTrends.com
Educational content only. The reference to Redwire Corp (RDW) is for illustrative and educational purposes only and is not a recommendation to buy, sell, or hold any security. Results from a single trade are not representative of typical results. Past performance is not indicative of future results. Trading stocks, futures, and options involves substantial risk of loss and is not suitable for every investor.