
It has been an interesting summer for the softs markets.
Back in June, several of these markets looked considerably different than they do today. Coffee was moving lower, cocoa had fallen sharply, sugar was trading quietly near its lows, and cotton had yet to show much sustained strength.
Fast-forward to the end of August, and the picture has changed quite a bit.
Coffee, cocoa, sugar and cotton have all experienced meaningful rallies. More importantly for us, each chart is now presenting a new set of levels and potential setups to watch.
As always, I’m less interested in trying to predict how far these moves will go and more interested in what price does next around important areas of support and resistance.
Let’s take a look.
December 2026 Coffee (KCZ26)
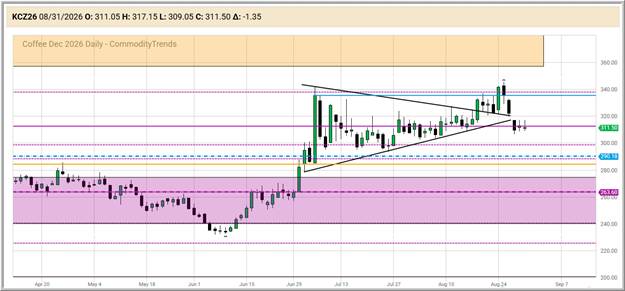
Coffee has staged a strong recovery from its June lows, formed a large triangle pattern, broke out to the upside and then broke back to the downside. It’s recently been trading in the 311.50-cent area.
There are certainly some supply and weather concerns helping support the market, but the strength has already been clearly visible on the chart.
The more important question for me is whether there is still a favorable trade setup after such a substantial rally.
First and foremost, the August 25 high is NOT the 12-month high. So, this market is NOT working on a 1-2-3 top formation. Looking across the different timeframes, the PURPLE monthly levels (horizontal lines) continue to provide the larger framework support and resistance. The GOLD weekly chart support level below is at 284.20. There is also a zone of resistance above via the large rectangle. The bottom of the rectangle is near 357.65.
At this point, I do not see a tradeable chart pattern that I’m interested in. So, I’ll continue to watch for a recognizable setup to develop per the strategies I teach on our website.
December 2026 Cocoa (CCZ26)
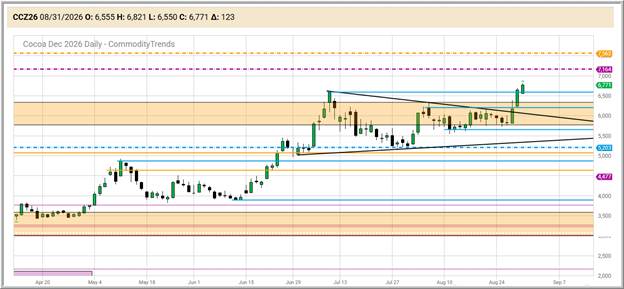
After trading near the 4,000 in June, December cocoa has exploded higher. It has broken out of its large triangle pattern in strong fashion and up and out of the gold weekly chart resistance zone!
While there continues to be concerns about future cocoa production, but for me the chart remains the deciding factor.
On the daily chart, I’m watching the purple dashed-dotted line above, which is the monthly chart 50% level, and the weekly chart 50% level, which is the gold dashed-dotted line.
If the current rally begins to stall and price eventually develops a 1-2-3 top, that could become interesting. On the other hand, if cocoa continues through resistance, then we simply have more information to work with.
Either way, there is no need to force a trade.
October 2026 Sugar (SBV26)
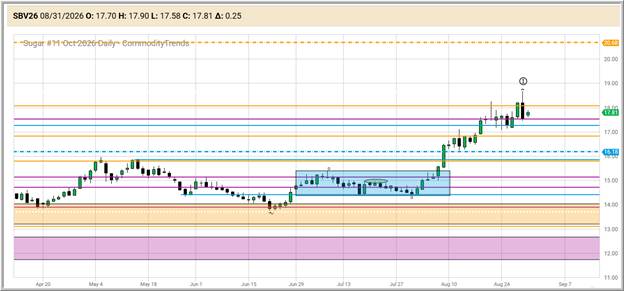
Sugar may be the most interesting example of how quickly market conditions can change.
Earlier this summer, the market was trading quietly in the low-14-cent area and attracting very little attention. Since then, October sugar has rallied sharply and recently traded above 18 cents!
This is one of the reasons I continue to watch markets even when they appear to be doing very little.
Quiet periods can allow a market to build a base, establish support and eventually develop the structure needed for a potentially larger move. We don’t know in advance whether that will happen, but the chart often begins providing clues before the market attracts much attention.
Now that the rally has already occurred, the question becomes what happens if price comes back toward the breakout area.
On the daily chart, I’m watching the combination of blue daily, gold weekly and purple monthly chart support levels via the horizontal lines below. The weekly 50% level above price is quite a distance away, located at 20.68.
If price retraces and holds above prior resistance, that could become much more interesting than simply chasing the market after a strong run.
December 2026 Cotton (CTZ26)
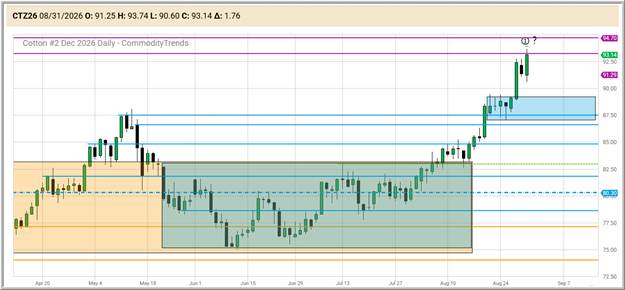
Cotton has also made an impressive move, recently producing a new contract high. There are some supportive supply-and-demand factors in the background, but once again, I want the chart to determine whether there is actually a trade.
The purple monthly chart resistance levels I’m currently watching are at 93.23, and the one above at 94.70. If these resistance levels hold, I’ll watch closely to see whether one of our setups begins to develop. If it continues moving higher without offering an entry that fits our rules, that is perfectly fine too.
One of the easiest mistakes to make after watching a market rally is believing that we have to participate. We don’t. There will always be another market and another setup.
What These Markets Have in Common
Coffee, Cocoa, Sugar and Cotton may all have different stories behind their recent moves, but the charts provide the same reminder:
Markets can change quickly.
A chart that looked weak a couple of months ago can suddenly become one of the strongest markets on the board. Likewise, a market that appears unstoppable today can eventually reach resistance and reverse.
Our job isn’t to know in advance when those turns will happen. Instead, we identify the important areas on the chart, wait for price to reach them, and then see whether price sets up and opportunity that meets our criteria.
Right now, several of the softs markets have already made substantial moves. That doesn’t necessarily mean the opportunities are over, but it does mean I’m going to be patient. Rather than chasing what has already happened, I’ll continue watching the support and resistance levels that could help define what happens next.
Watch the levels. Wait for the setup. Control the risk. Then let the market make the decision.
The Next Step
If you are new to CommodityTrends, our memberships take these ideas a step further. We show you how we read the charts in real time, analyze the markets each day, and identify potential trading opportunities as they begin to develop.
To learn more about our memberships, visit: https://www.commoditytrends.com/register
— Jim Prince
Educational content only. Futures and options trading involves substantial risk of loss and is not suitable for every investor. Nothing here is a recommendation to buy or sell any contract. Past performance is not indicative of future results.