

Softs Market Check-In: Coffee, Cocoa and Sugar (June 15, 2026)
A walk through the daily charts for coffee, cocoa and sugar as of Monday, June 15, 2026 — three markets that scared everybody to death a year ago, and what's left now that the fear is leaking out.
Remember when nobody could stop talking about the softs? Chocolate was going to cost a fortune. Your morning coffee was going to break the bank. Sugar ran to prices that made no sense at all. Every headline was a panic, and every panic pushed price higher.
Well, here we are. It's the middle of June. Brazil is deep into its coffee and sugarcane harvest, and one by one, these wild markets are coming back down to earth. The fear is draining out.
Here's the thing to chew on before we walk the board. A market falling because the scary story turned out smaller than everybody thought is *not* the same as a market that's a screaming bargain. A falling knife is still a knife. Our job isn't to guess where it stops — it's to let the chart show us. Let's take a look.
September 2026 Coffee (KCU26)
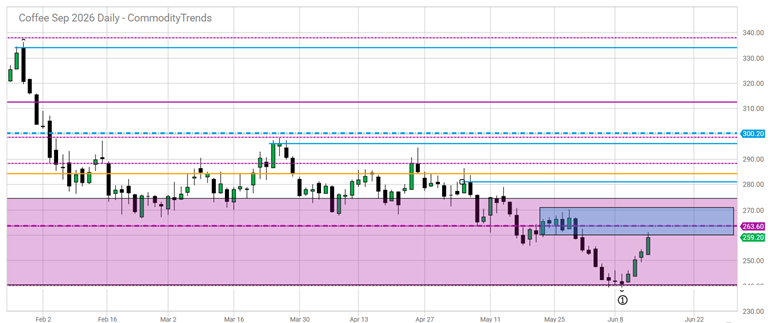
September arabica coffee has been trading down around the 259 area, brushing up against its lowest level in about 19 months. Quite a comedown for a market that was the talk of the town not long ago. What changed? Brazil. The 2026/27 harvest is rolling in and the talk now is of a big crop, not a shortage. When the story flips from "not enough" to "plenty," price tends to follow in a hurry.
So, step back and use the timeframes the way I teach. The PURPLE monthly chart zone that I'm watching is the one price is currently trading in. It’s the area that tells us whether this is a healthy give-back or something bigger. The GOLD weekly resistance level that I’m interested in is the horizontal line at 283.70. And on the BLUE daily resistance zone is an area that price is now poking into, which is where I'd start watching for a possible 1-2-3 bottom to even *begin* to form.
Notice I said begin. Coffee is famous for fooling people. I'm in no hurry here.
September 2026 Cocoa (CCU26)
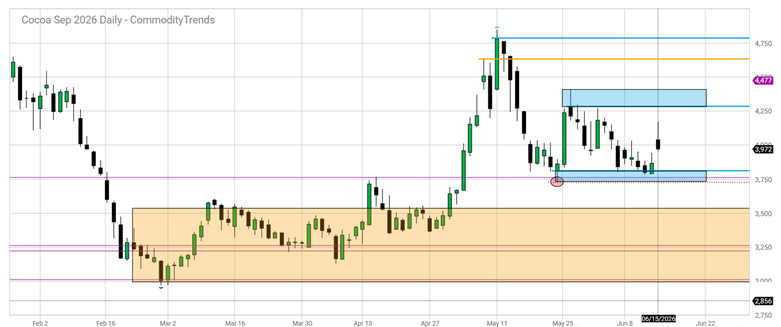
Cocoa is the poster child for this whole story. This is the market that went parabolic during the 2024 supply scare — straight up, day after day, until it ran completely out of breath. Now it's been sliding back, trading down near the 3,900-4,000 area. This occurred while exchange warehouse stocks are piling up to multi-year highs. More cocoa sitting in the warehouse means less reason to panic.
Here's the lesson cocoa teaches better than any market I know: a parabolic move and a healthy trend are not the same animal. Straight-up moves come straight back down a stunning amount of the time. The level I'm watching on the daily is the blue zone with the MET trigger point to the downside at 3725 (see the red ellipse). Be aware though that there is a large weekly chart gold support zone just below.
Could it bounce? Of course it could. But I don't want to be the hero who catches it mid-air. I'd rather let the chart prove a possible move lower is real before I get interested.
October 2026 Sugar (SBV26)
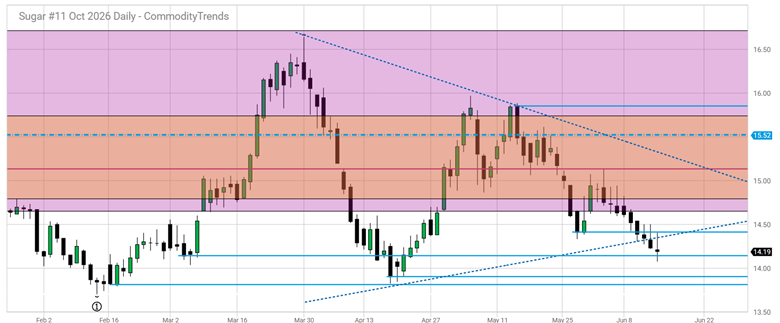
October world sugar #11 has been grinding around the low 14s — about 14.19 cents a pound — and frankly, it's been the quiet one of the group. No fireworks, no screaming headlines. Just a heavy, sleepy market drifting lower while Brazil's cane harvest keeps the supply taps open.
And you know what? Quiet markets are where some of the cleanest setups eventually hide. Nobody's watching, nobody's excited — and that's often exactly when a market carves out a base while the crowd looks the other way. On the daily chart, price just broke below the lower trend line of a large triangle. I’m looking for a possible retracement back to the breakout level to set up a short entry. Patience in a boring market is still patience. It counts.
The Common Thread
Here's what ties these three charts together: each of them was a fear trade at some point in the last two years. Cocoa and coffee went vertical on supply scares. Sugar rode the wave. And now, one by one, the fear came out and price moved down.
So what's the lesson? It’s the same one I come back to again and again. Don't trade the headline — trade the chart. A year ago the headlines screamed "shortage" near the highs. Funny how those same headlines go quiet right when these markets get cheap. That's not a coincidence. That's just how fear works.
Falling prices feel like bargains. But a market coming down off a fear spike has no idea where it's "supposed" to stop, and neither do you and I. That's why we don't guess. We wait for the chart to carve out a real bottom — a 1-2-3, an MET, a base that holds — and we define our risk *before* we click the mouse, not after.
The crowd chased these markets up on fear. We're going to do something harder, and a whole lot smarter — wait, watch our levels, and let the chart tell us when the falling knife has finally hit the floor.
That's the patient road. It's the only one that lasts.
— Jim Prince, CommodityTrends.com
Educational content only. Futures and options trading involves substantial risk of loss and is not suitable for every investor. Nothing here is a recommendation to buy or sell any contract. Past performance is not indicative of future results.