

Two Fresh MET Entries: Bath & Body Works (BBWI) and Alaska Air (ALK)
Two stocks that just triggered long Momentum Entry Technique (MET) signals on June 24, 2026 — where the entry fired, where a stop fits below recent lows, and where the next resistance sits overhead.
One of my favorite things about the Momentum Entry Technique is how little guessing it asks of you. You mark the line. You wait. When price breaks the green dashed line, the trigger fires — not a minute before. No predicting, no hoping, no trading from the hip. The chart goes first, and you follow.
Today two stocks did exactly that. Let's walk them.
Bath & Body Works (BBWI)
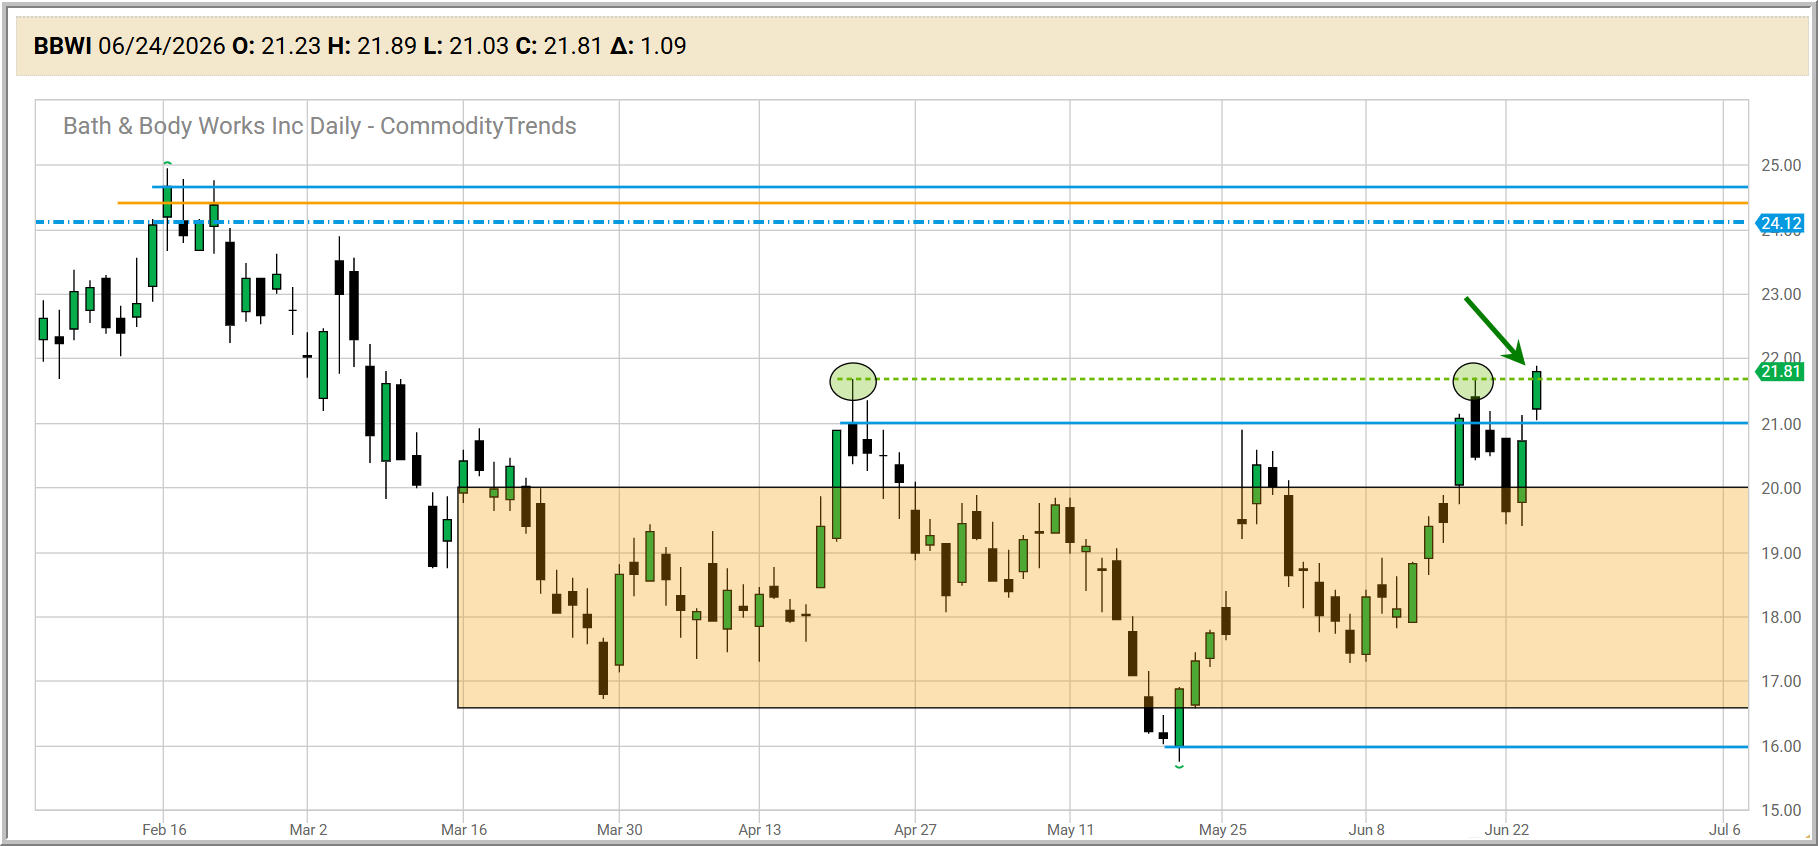
BBWI closed at 21.81, up 1.09 on the day — a strong push right through the green dashed MET line (see the green arrow). That line wasn't random. It was drawn off two earlier swing highs, both circled on the chart, back in April and again in June. Price tried that ceiling twice and got turned away. Today it broke through.
For most of the spring this stock was stuck inside that big shaded weekly chart range between roughly 16.50 and 20.00. It chopped sideways, frustrated everybody, and went nowhere. Now it's climbed up out of that box and tripped the momentum trigger above it. That's the kind of setup the MET is built for.
So where's the risk? A logical stop sits below the recent lows — down around the 19.50 pullback area, which also tucks back under the top of that old 20.00 range. If price is going to keep going, it shouldn't be falling back into the box it just left.
And the target? I always look to the next horizontal line overhead. Here that's the blue daily chart 50% level up near 24.12, where price topped out back in February. That's the next real shelf of resistance, and it's the spot I'd be watching as this move plays out.
Alaska Air Group (ALK)
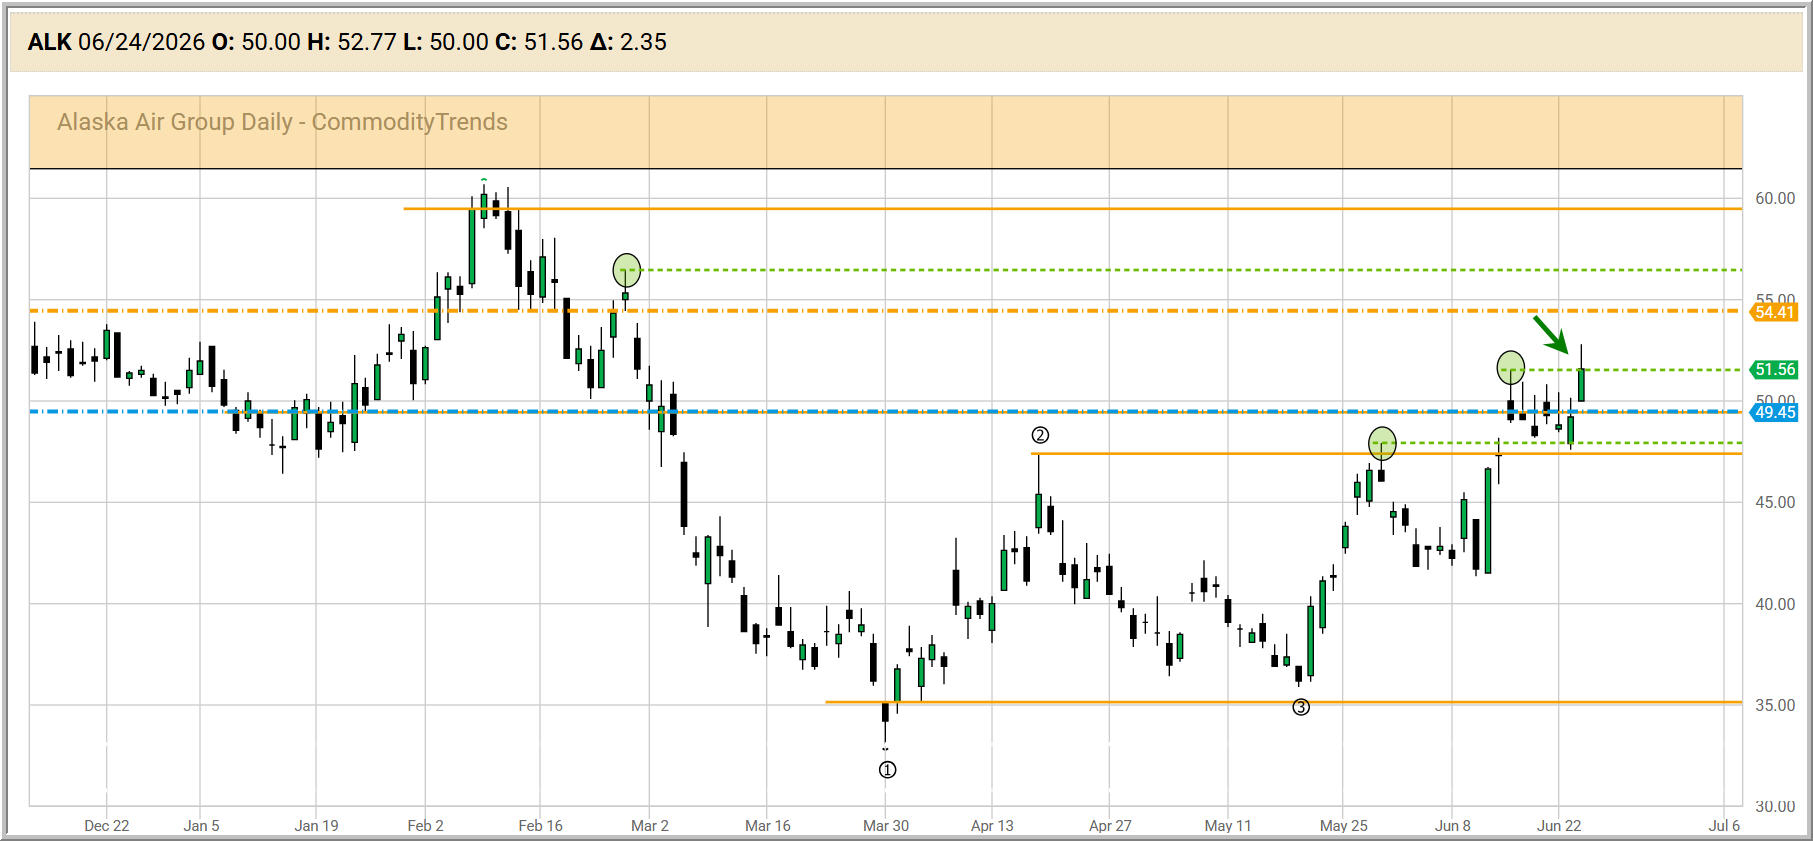
ALK is a cleaner story than it looks at first glance. Notice the 1-2-3 bottom marked on the chart: point ① is the March low near 33, point ② is the reaction high, and point ③ is the higher low that held back in May. That's a textbook bottoming sequence — and it set the stage for what happened today.
The stock closed at 51.56, up a sharp 2.35, breaking the green dashed MET line (green arrow again), but eventually settled just above the trigger level. Just as nice, that breakout cleared the blue horizontal daily chart 50% level at 49.45 level on the way up, so price is now sitting above a line that had been giving it trouble.
Stop placement? Below the recent lows. The pullback lows came in around the 49.45 area — slip a stop under that shelf and you've defined your risk before you ever got involved. If buyers mean business, price shouldn't be revisiting those lows.
Overhead, the next horizontal line is the orange 54.41 - the weekly chart 50% level. That's the next band of resistance and the logical spot to watch as a target for this leg. Above that, the bigger 60.00 shelf is still way up there from the February highs — but one line at a time.
The Common Thread
Here's what I love about both of these. Neither one asked me to be a hero. I didn't have to call the bottom, predict the news, or chase a candle. I drew a line off prior structure, I waited, and when price broke it the trigger told me the moment had arrived.
That's the whole idea behind the MET and CTTP 3.0: let the chart tell you when, mark your risk below the recent lows so you know your if-wrong before you start, and keep your eyes on the next horizontal line for your target. Entry, stop, and target — all of it visible, all of it planned, none of it guessed.
The crowd reacts. We follow the line.
— Jim Prince, CommodityTrends.com
Educational content only. Trading stocks, futures, and options involves substantial risk of loss and is not suitable for every investor. Nothing here is a recommendation to buy or sell any security. Levels and targets discussed are chart observations, not predictions. Past performance is not indicative of future results.