CommodityTrends Weekly Newsletter
Check our CommodityTrends Weekly Newsletter
Our Weekly Newsletter is published on a weekly basis. It is available online as well as emailed each week, exclusively for members of CommodityTrends.
View the trade opportunities and commodity markets Jim is watching to see where the markets may be headed.
Summary
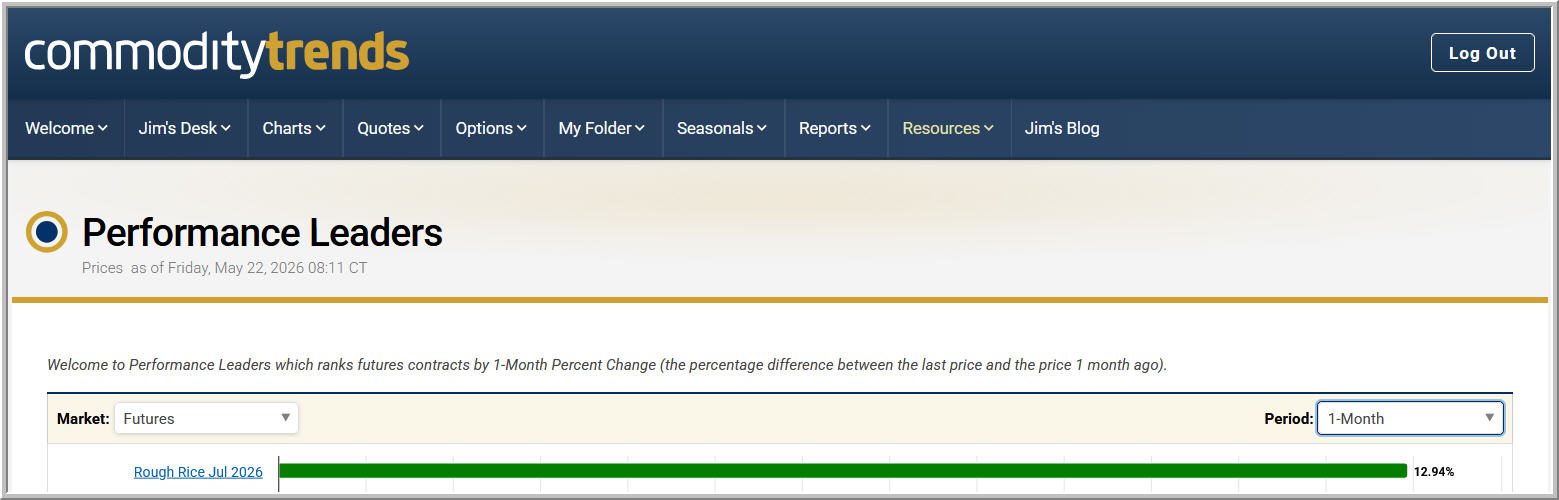
July Rough Rice Pushes Into Resistance After a Strong One-Month Rally
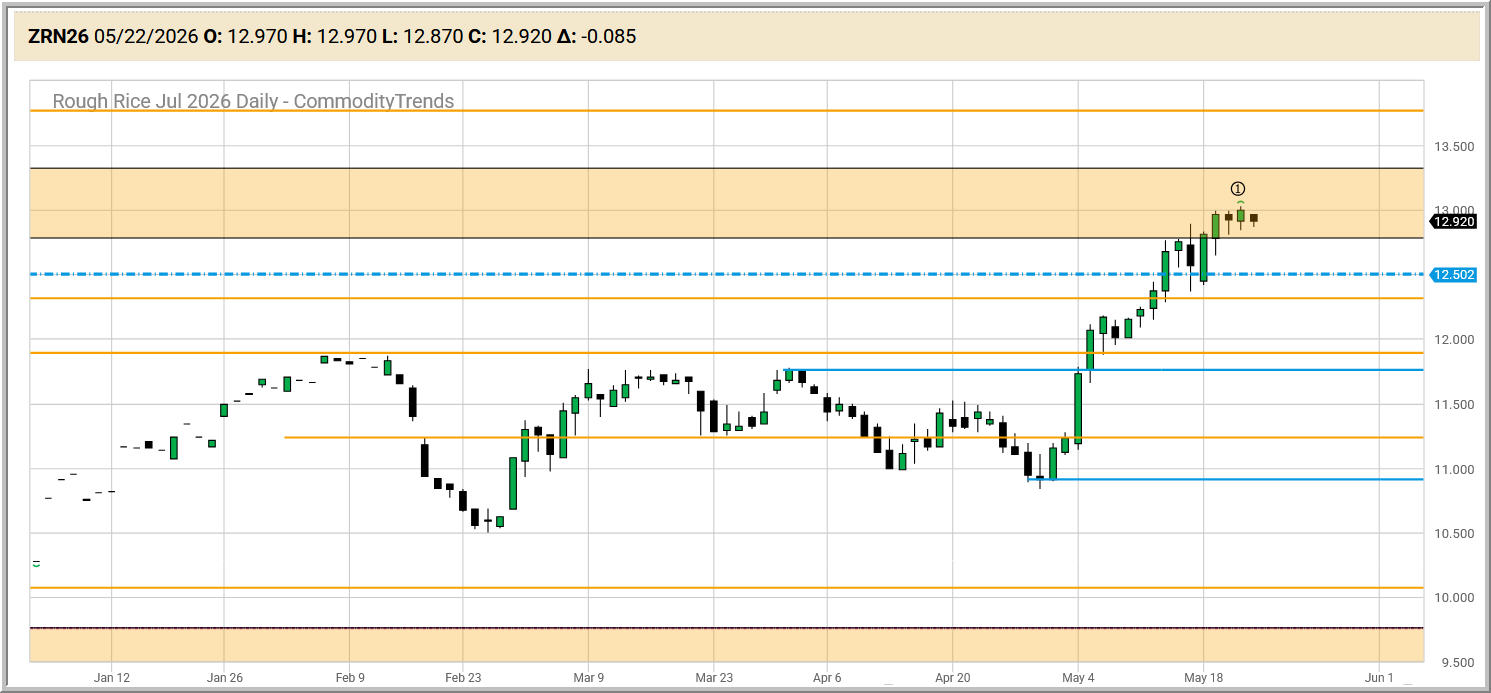
Jul Rough Rice has quietly become one of the stronger movers in the Grains sector. Over the last one month, July Rough Rice is up 12.94%, which is a very strong move for this market. Most of that strength has shown up since the April 29 low, where price found support and then began a steady push higher.
What stands out to me on the daily chart is how clean the rally has been. After that late-April low, price broke higher in early May and then kept pressing upward. There were a few small pauses along the way, but buyers continued to step in and push this market to higher levels.
Now, though, price has reached an important area.
July Rough Rice is currently trading inside a **weekly chart resistance zone**, shown by the gold rectangle on the chart. This is where I want to be a little more careful. A strong rally into resistance is not automatically bearish, but it does tell me the easy part of the move may already be behind us.
Price has also just produced a **#1 top point** inside that weekly resistance zone. That does not mean the rally is over. It simply means price has now given us a possible first warning sign that momentum may be slowing, at least for the short term.
From here, I would be watching to see if a full 1-2-3 top formation begins to take shape. If price pulls back and then attempts another rally that fails below or near the recent high, that could give us a more complete topping pattern to evaluate.
On the other hand, if Rough Rice can close strongly above this weekly resistance zone, that would be a much different message. A clean breakout above resistance would suggest buyers are still in control and could open the door for even higher prices.
So, for now, I see July Rough Rice as a strong market that has earned my attention, but it is also trading in a price area where I do not want to get careless. The trend has been up, the one-month move has been impressive, and buyers have clearly had control since late April. But now price is at resistance, and that is where markets often have to make a decision.
In plain English, I would not want to chase this market blindly after such a strong run. I would rather let the chart give me the next clue. Either price proves it can break through this weekly resistance zone, or it starts to build a topping pattern that tells us the rally may need a rest.
And that, really, is the whole point of having a plan. Everything I just walked through on Rough Rice — reading the #1 top point, watching for a 1-2-3 top, respecting resistance instead of chasing — comes straight out of the CommodityTrends Trading Plan. Which brings me to some news I'm excited to share.
We've officially upgraded to CommodityTrends Trading Plan 3.0. This update reflects everything we've learned from years in the markets and from working alongside members like you. The core philosophy hasn't changed: follow a tested plan, manage your risk, and let the trends do the heavy lifting. But two things about 3.0 are worth highlighting. First, it's no longer limited to just 5 markets, so you'll have a much wider universe of opportunities to work with — exactly like the Rough Rice setup above. Second, it is not algo-based. This is a real trading plan grounded in sound principles and human judgment, not a black-box algorithm spitting out signals you don't understand. You'll always know the "why" behind every trade.
If you're already a Premium member, 3.0 is built right into the service — you'll see it in the daily videos, the alerts, and the training materials going forward. And if you've been reading these letters from the sidelines, this is a great time to come aboard and learn the same plan I use in the markets every day. You can get started in just a couple of minutes here: http://commoditytrends.com/register. As always, it's month-to-month with no contracts, and our Course Counselors are standing by if you have any questions.
Markets I'm Watching
View the trade opportunities and markets Jim is watching along with the Trend Seeker rating per commodity to see where the market is headed. Here are the markets and opportunities I am watching right now. For more information about these markets, be sure to check My Chart Book and CommodityTrends Daily Video Service.
Grains Market
Jul Soybean Oil has a #1 top point at 76.99 (the high on May 05). The #2 point is 72.95 (the low on May 14). The #3 point is 76.32 (the high on May 20). A break below the #2 point will trigger an entry to the downside. The initial stop loss can be placed just above the #3 point. The initial target is the daily chart support level at 69.64 (the blue horizontal line).
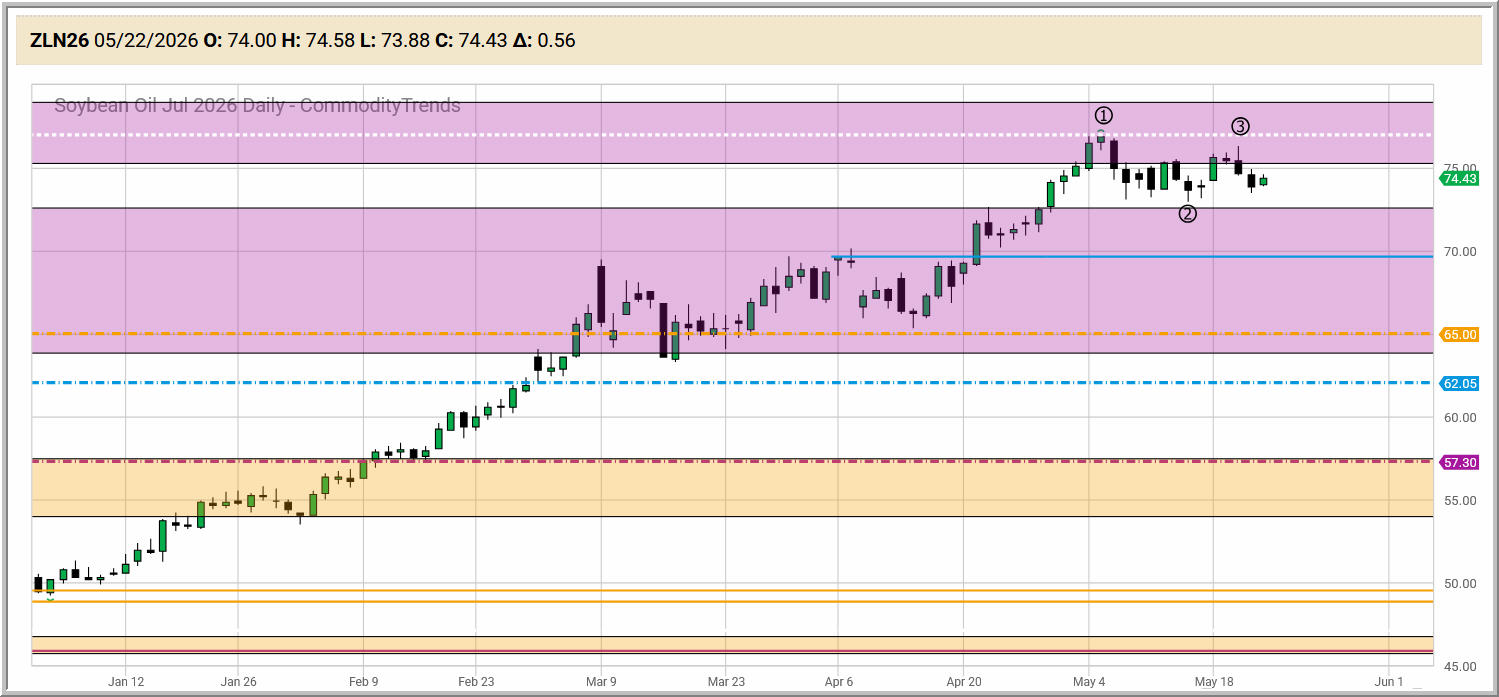
Jul Soybean Oil has a #1 top point at 76.99 (the high on May 05). The #2 point is 72.95 (the low on May 14). The #3 point is 76.32 (the high on May 20). A break below the #2 point will trigger an entry to the downside. The initial stop loss can be placed just above the #3 point. The initial target is the daily chart support level at 69.64 (the blue horizontal line).
Metals Market
Jul High Grade Copper has developed a #1 top point at 6.7160 (the high on May 13). The #2 point is 6.1475 (the low on May 20). Keep watching to see if all of the 1-2-3 strategy criteria are met.
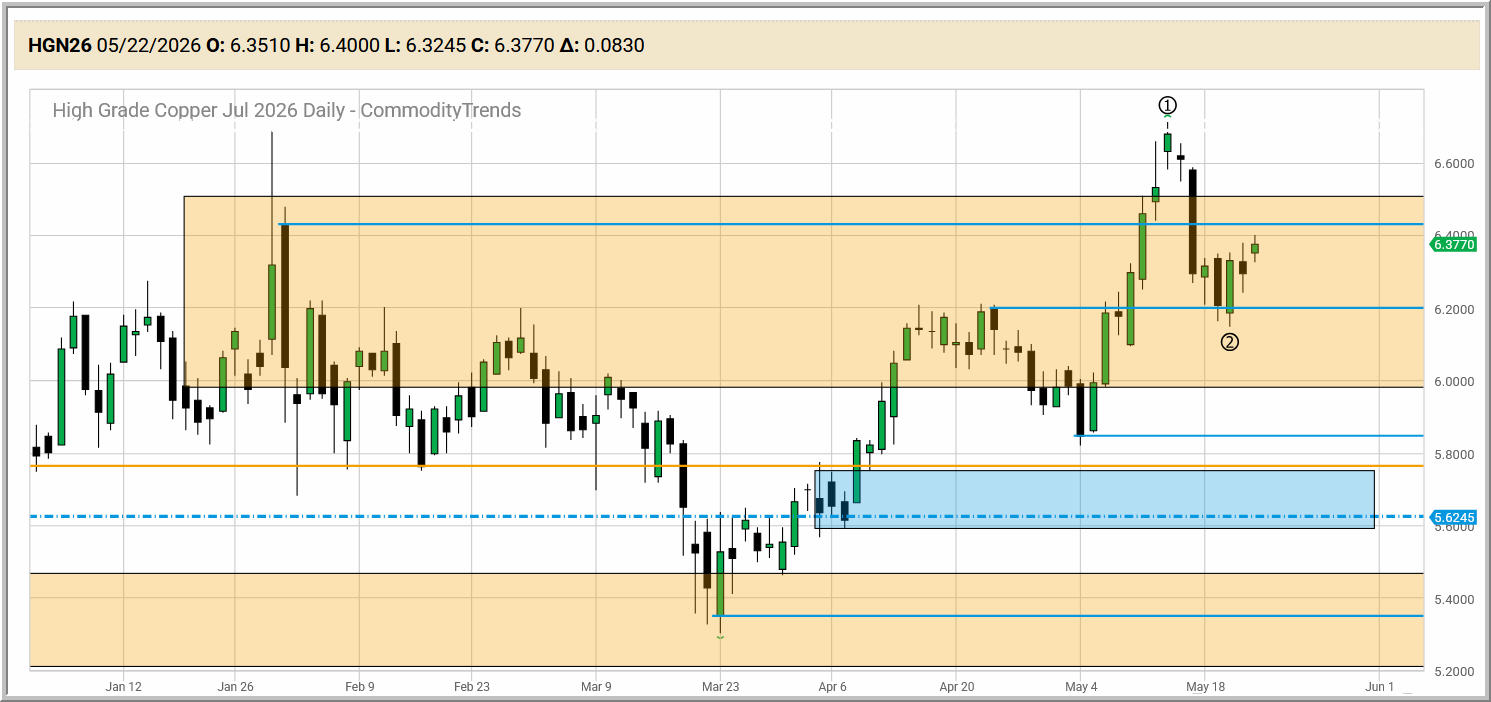
Jul High Grade Copper has developed a #1 top point at 6.7160 (the high on May 13). The #2 point is 6.1475 (the low on May 20). Keep watching to see if all of the 1-2-3 strategy criteria are met.
Energies Market
If you’re a regular reader of this letter, then you may remember that several weeks ago I wrote the following: "Jun Natural Gas developed a #1 bottom point at 2.592 (the low on April 30). The #2 point is 2.883 (the high on May 4). The #3 point is 2.676 (the low on May 7). A break above the #2 point would trigger an entry to the upside. The initial stop loss can be placed just below the #3 point. The initial target is just below the top of the purple monthly chart zone. You can see this illustrated in the sample risk/reward box I’ve drawn on the chart. Please keep in mind, this is only an example."
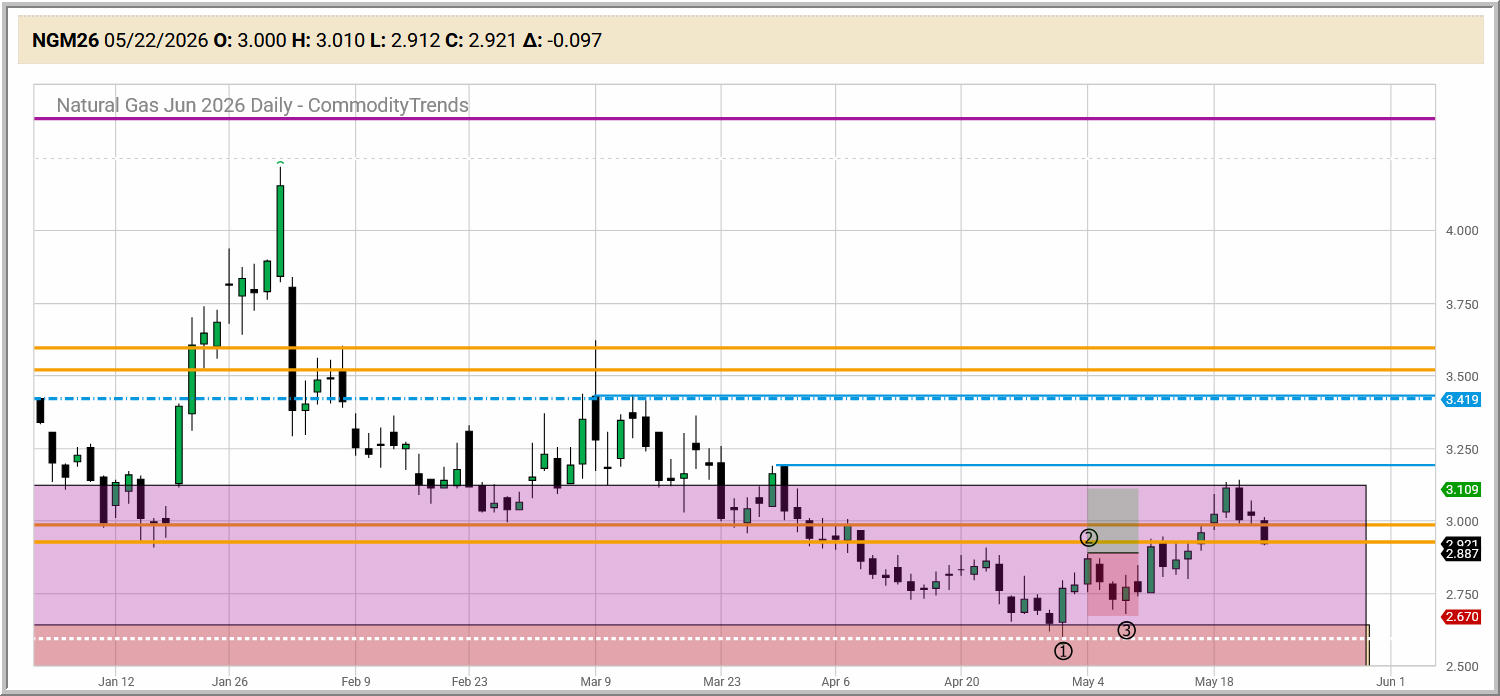
The target was hit on May 19. The stop loss on any remaining positions can be moved to just above the entry price. Please note that First Notice Day (FND) is May 28, so any remaining positions should be exited 3–5 days before that date.
If you’re a regular reader of this letter, then you may remember that several weeks ago I wrote the following: "Jun Natural Gas developed a #1 bottom point at 2.592 (the low on April 30). The #2 point is 2.883 (the high on May 4). The #3 point is 2.676 (the low on May 7). A break above the #2 point would trigger an entry to the upside. The initial stop loss can be placed just below the #3 point. The initial target is just below the top of the purple monthly chart zone. You can see this illustrated in the sample risk/reward box I’ve drawn on the chart. Please keep in mind, this is only an example."
The target was hit on May 19. The stop loss on any remaining positions can be moved to just above the entry price. Please note that First Notice Day (FND) is May 28, so any remaining positions should be exited 3–5 days before that date.
Meats Market
Jun Live Cattle developed a #1 top point at 256.625 (the high May 1). The #2 point is 24.475 (the low on May 11). The new #3 point is 255.775 (the high on May 18). A paper trading entry to the downside was triggered on May 20 when price broke below the May 19 low. The initial stop loss is just above the #3 point. The initial target was the top of the gold weekly chart zone at 248.050 -- which was hit today.
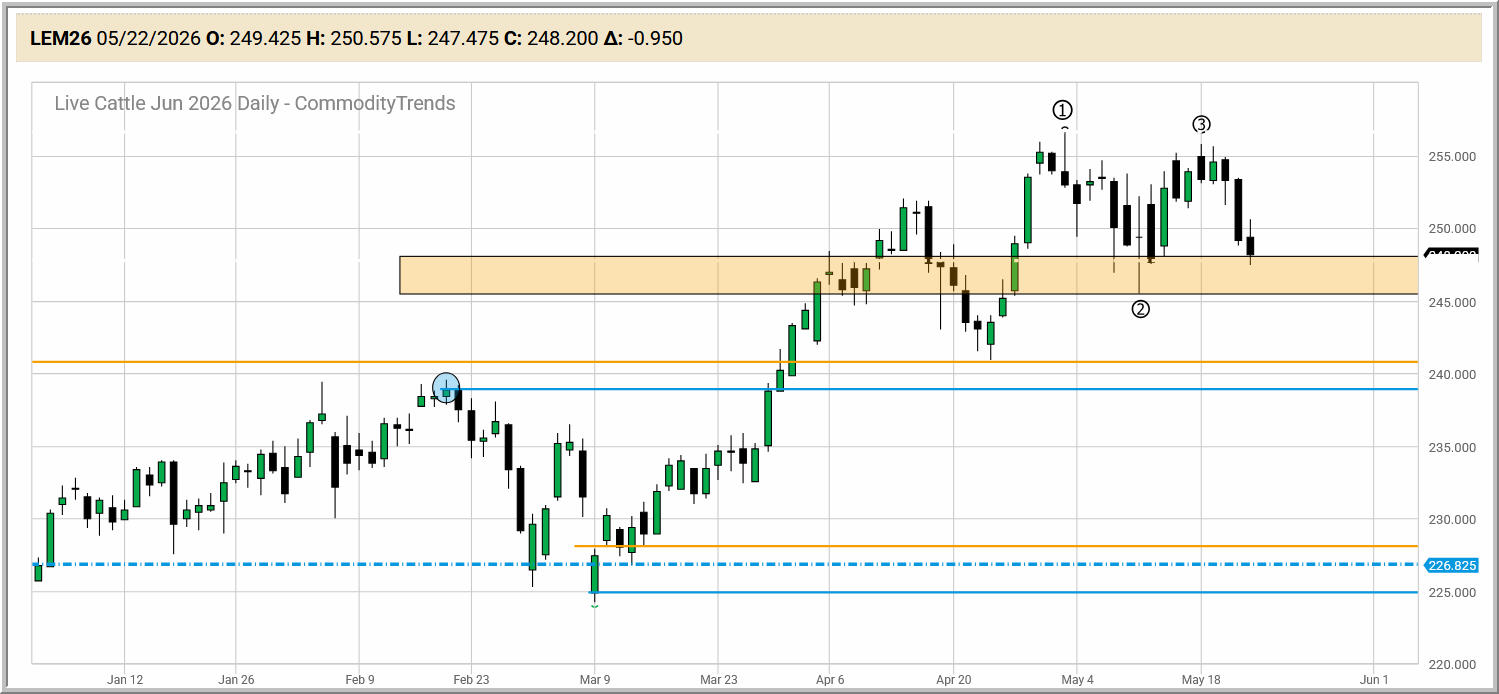
Stops on any remaining positions can be moved to just above the May 20 low (which is minor resistance).
Jun Live Cattle developed a #1 top point at 256.625 (the high May 1). The #2 point is 24.475 (the low on May 11). The new #3 point is 255.775 (the high on May 18). A paper trading entry to the downside was triggered on May 20 when price broke below the May 19 low. The initial stop loss is just above the #3 point. The initial target was the top of the gold weekly chart zone at 248.050 -- which was hit today.
Stops on any remaining positions can be moved to just above the May 20 low (which is minor resistance).
Foods/Softs Market
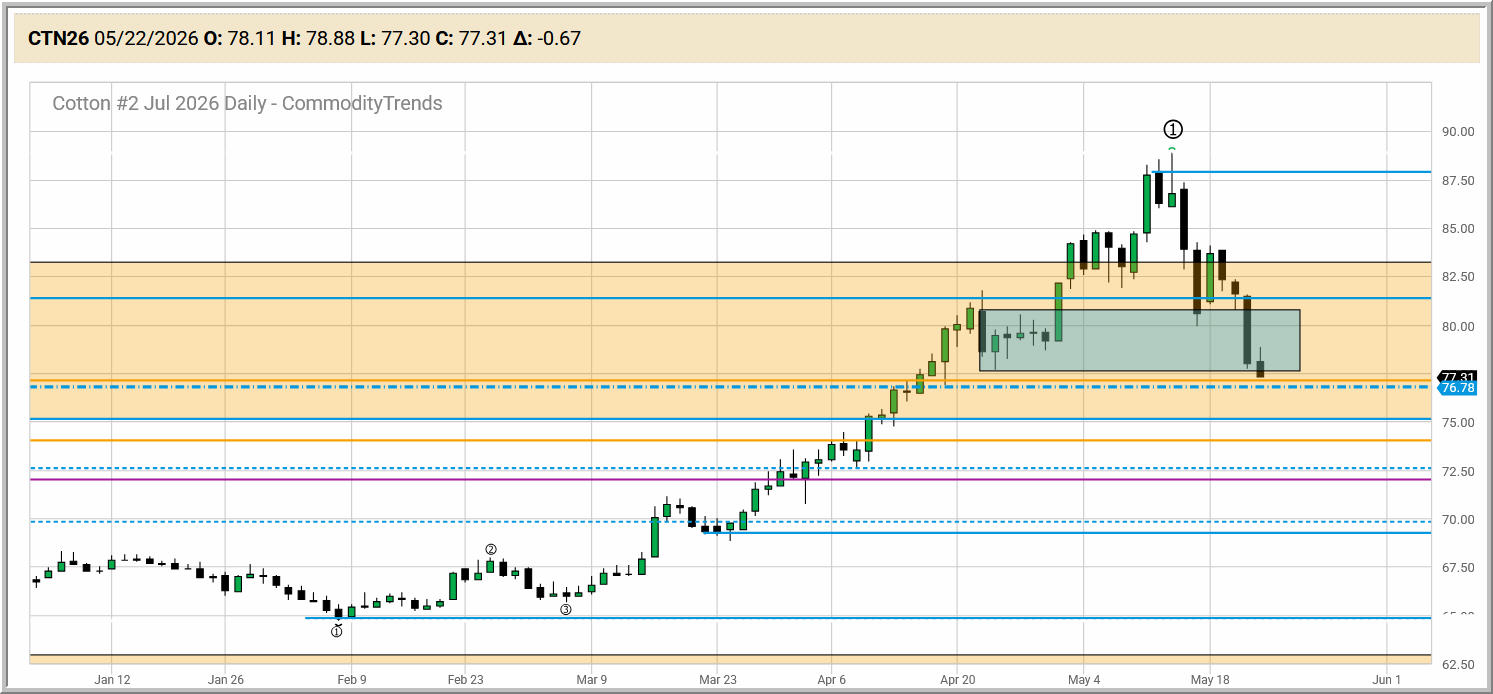
Jul Cotton #2 has moved too far, too fast without forming a tradable chart pattern. Because of that, I’m going to stop watching this market for now. If a new setup develops in the near future, I’ll bring it back to this letter.
Jul Cotton #2 has moved too far, too fast without forming a tradable chart pattern. Because of that, I’m going to stop watching this market for now. If a new setup develops in the near future, I’ll bring it back to this letter.
Stocks and Exchange Traded Funds Market
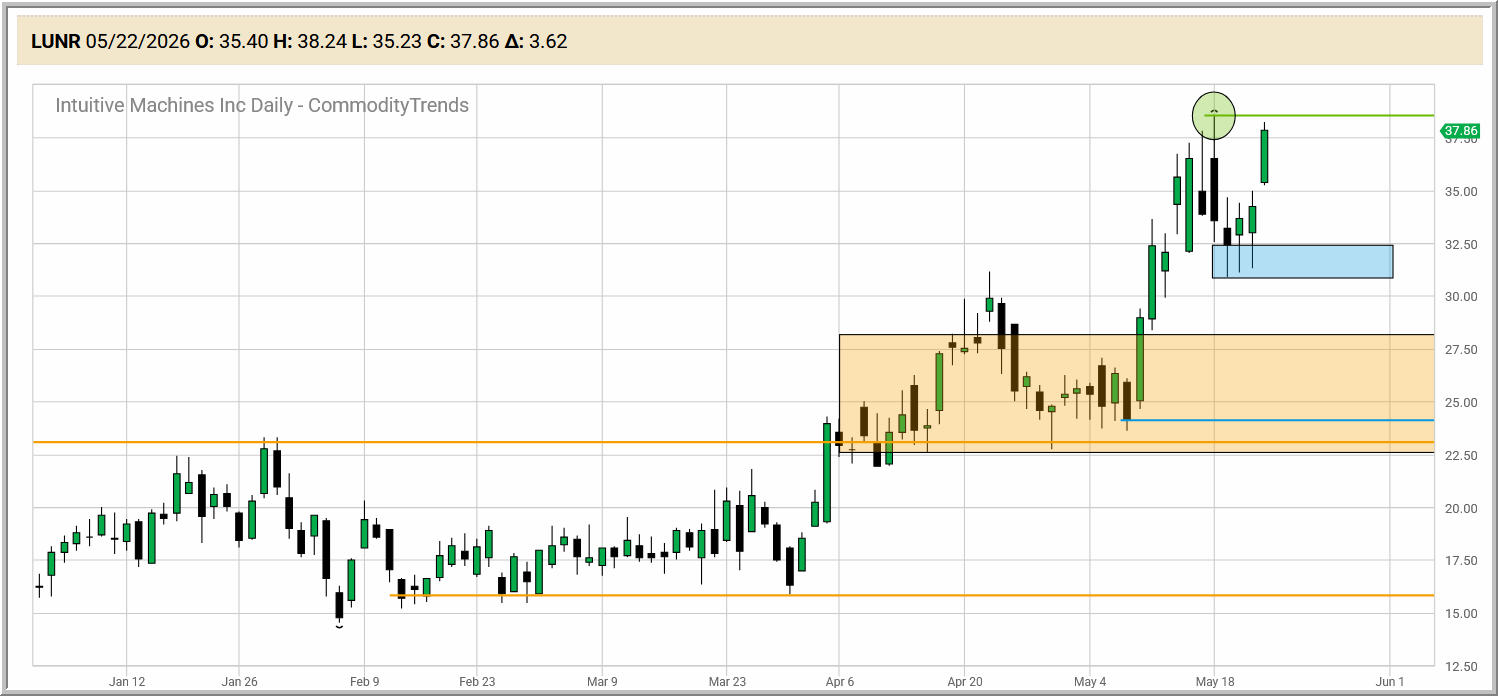
Intuitive Machines Inc (LUNR) is on the verge of triggering an MET entry to the upside. Keep watching.
Intuitive Machines Inc (LUNR) is on the verge of triggering an MET entry to the upside. Keep watching.
Stocks and Exchange Traded Funds Market
Quantum Computing Inc (QUBT) is also on the verge of triggering an MET entry to the upside. Keep watching.
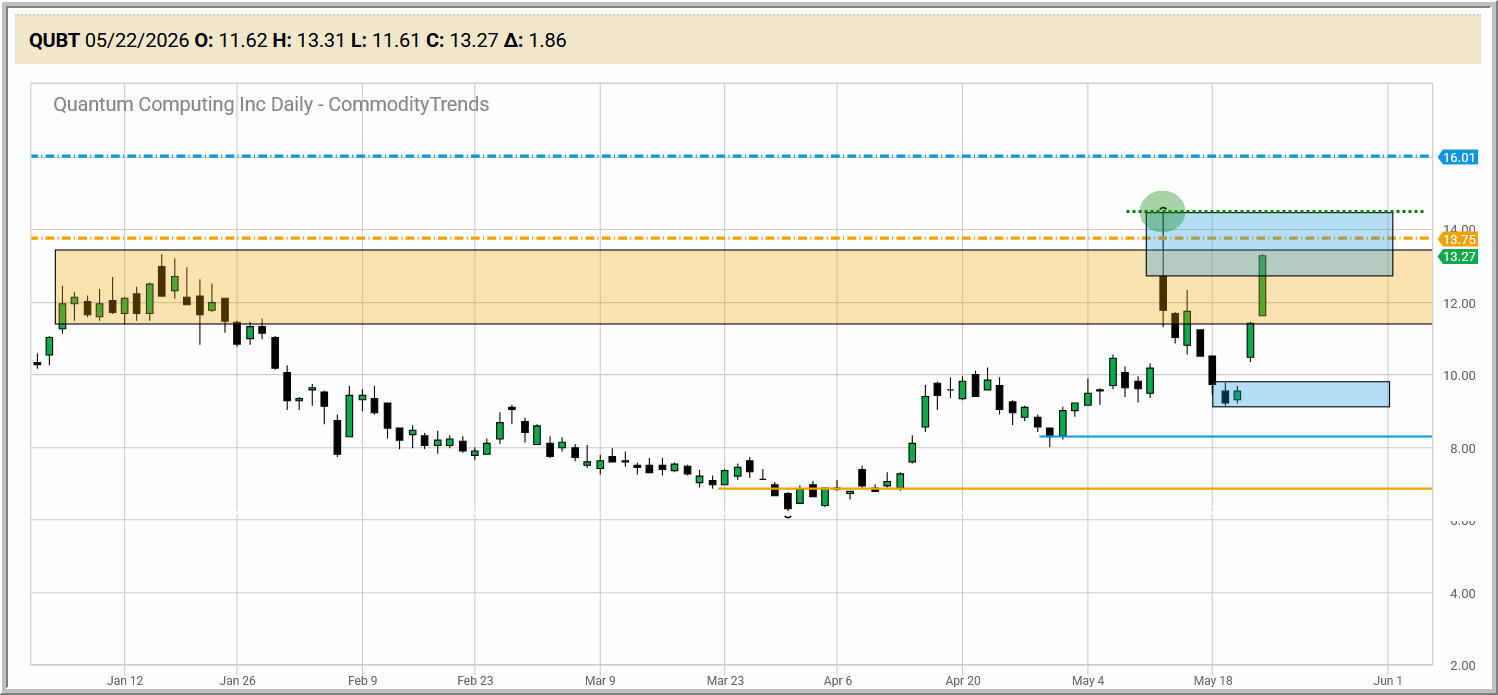
Quantum Computing Inc (QUBT) is also on the verge of triggering an MET entry to the upside. Keep watching.